Short answer: the order book lists limit orders waiting to buy (bids) and sell (asks) at each price. The tape (also called time and sales, or the trades feed) lists every trade that actually happened, with time, price, size and which side was aggressive. The order book shows intent; the tape shows action. Reading them together tells you whether buyers or sellers are in control right now, whether a big order is real, and whether a level is being defended or about to break.
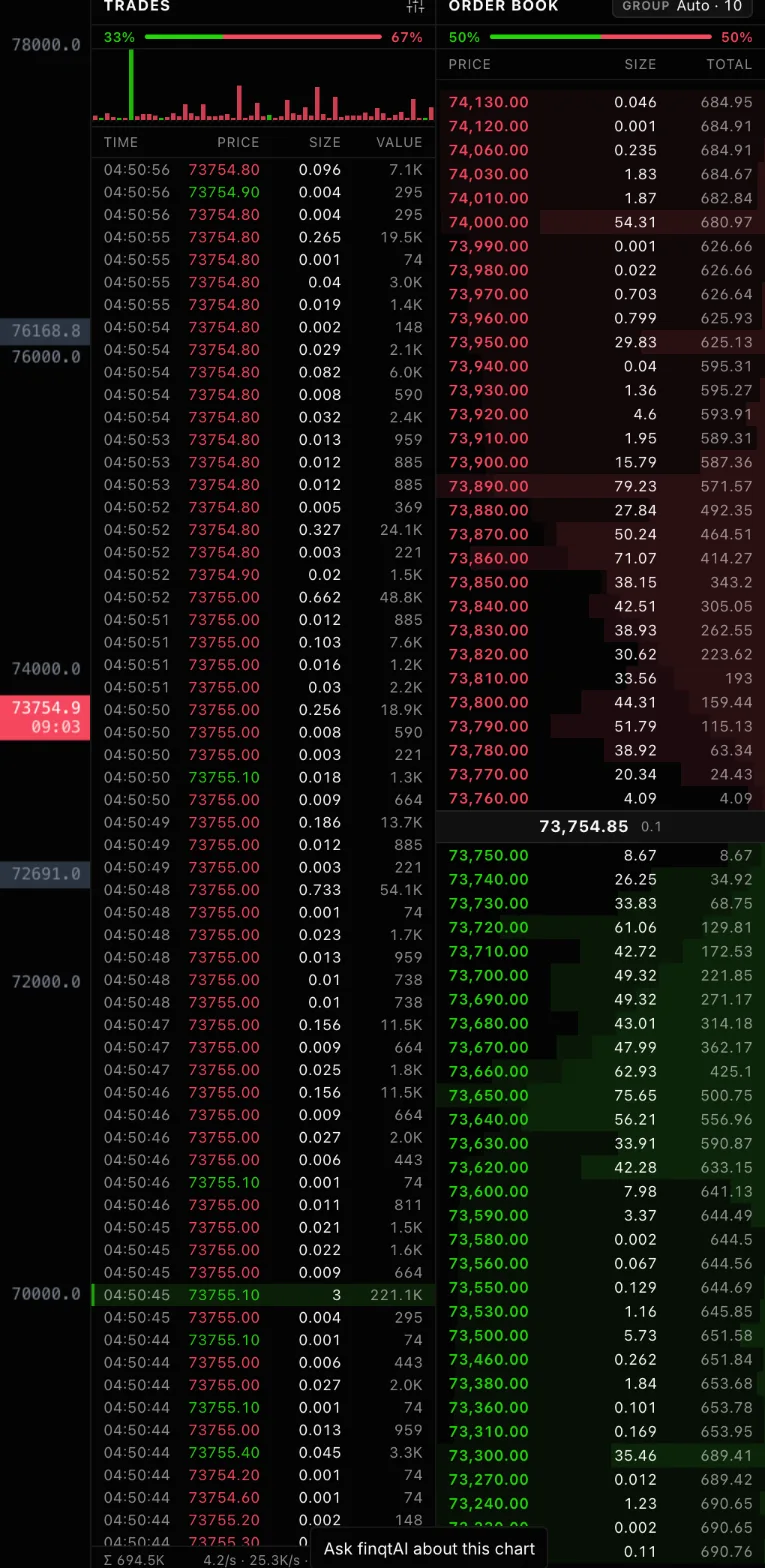 BTCUSDT order book (right) and trades tape (left) in finqt. Asks are red above the spread, bids green below; each tape row is one executed trade
The order book in one minute
The order book has two sides:
- Asks (red, above the spread): sellers waiting at a price. The lowest ask is the best price you can buy at immediately.
- Bids (green, below the spread): buyers waiting at a price. The highest bid is the best price you can sell at immediately.
- The spread is the gap between the best bid and best ask. In liquid markets like BTC perpetuals it is usually one tick.
Each row shows a price, the size resting there and a running total. A cumulative bar behind each row makes it easy to see where size piles up.
Limit orders add liquidity. Market orders take it. Every trade on the tape is a market order hitting a limit order that was sitting in the book.
The tape in one minute
Every row on the tape is one execution:
- Green prints are trades where the buyer was the aggressor (a market buy lifted an ask).
- Red prints are trades where the seller was the aggressor (a market sell hit a bid).
- Size and value tell you whether it was retail noise or someone meaningful.
The bar at the top of the tape summarises recent aggression, for example 33% buys against 67% sells over the visible window. That ratio changes second by second, and it is more honest than the book, because trades cannot be cancelled.
Four things to look for
1. Bid/ask imbalance
If the bids within a few ticks of price are much larger than the asks, there is more passive buying interest nearby than selling. This alone is weak, because orders can be pulled. It becomes meaningful when the tape agrees: heavy bids and mostly green prints.
2. Absorption
Price keeps getting hit with red prints but does not go lower, and the bid at that level refills. Someone is absorbing the selling. Absorption at a level you already care about (a range low, a prior high) is one of the cleanest order-flow signals there is.
3. Spoofing and pulled orders
A large order appears near price, never trades, and disappears as price approaches. Its job was to influence other traders, not to be filled. You cannot know intent, but you can watch behaviour: size that keeps moving away from price is not support.
4. Large prints
A single trade far larger than the surrounding ones, like a 3 BTC print in a stream of 0.01s, is a participant who needed size now. On its own it is just a data point; repeated large prints on one side in the same area are worth noting.
Why the heatmap helps
The order book only shows the present. Once an order is pulled, it is gone from the book forever. A liquidity heatmap records the book over time, so you can see how long a level has been there, whether it was refilled after trades, and whether it vanished just before price arrived.
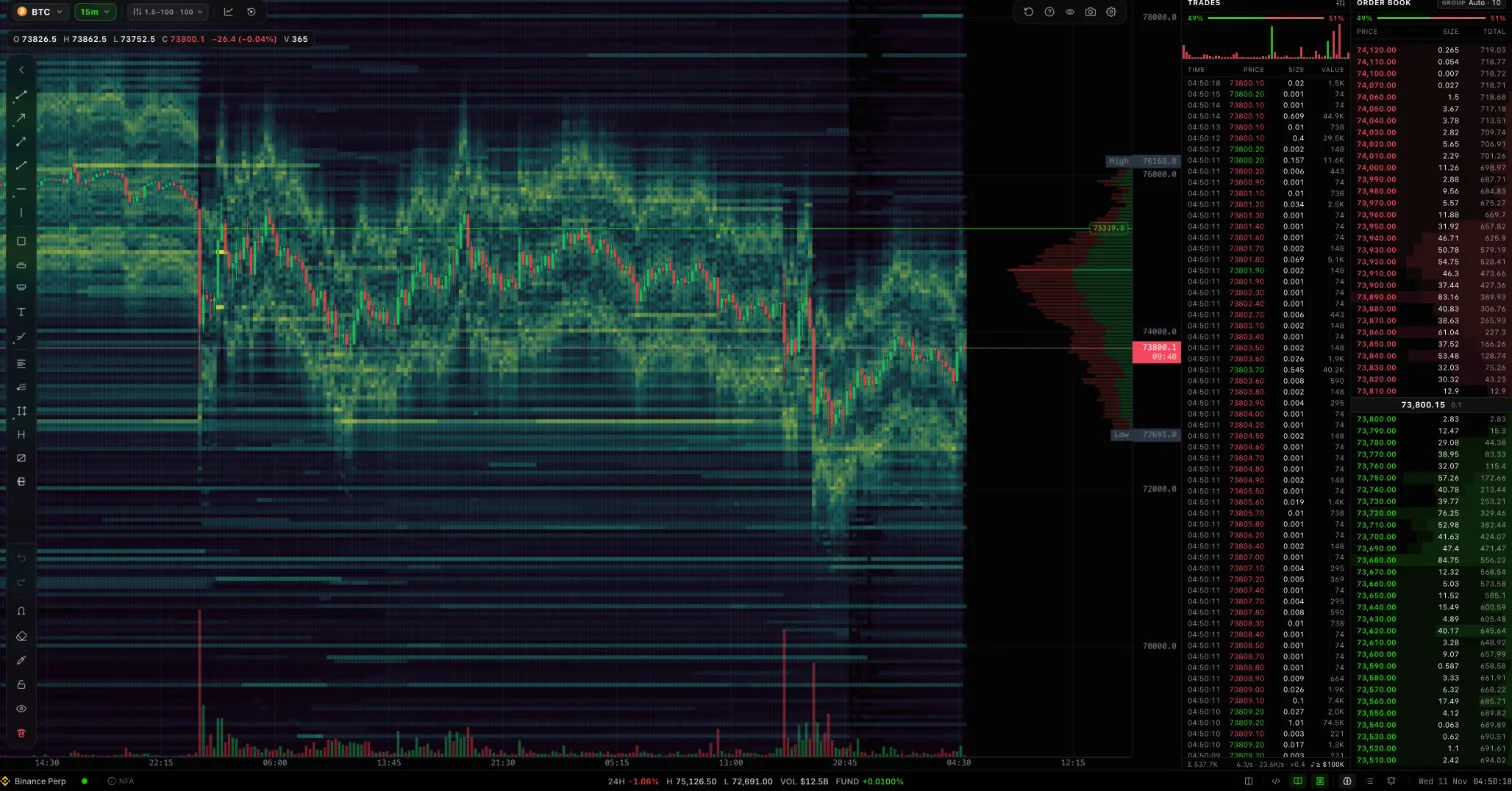 The full finqt liquidity view: heatmap with candles on the left, trades tape and order book on the right
In finqt the heatmap, volume profile, tape and order book sit side by side in the web app, so you can read all three at once instead of switching tabs.
Common beginner mistakes
- Trusting walls. A big bid is not support until it absorbs selling. Many walls are pulled.
- Ignoring the tape. The book can lie; executed trades cannot.
- Reading too fast. On liquid pairs the book updates many times a second. Zoom out to a few seconds of behaviour, not single ticks.
- Using order flow alone. Order flow is timing, not direction. Use it inside a plan built on structure and risk.
Frequently asked questions
What is the difference between the order book and the tape?
The order book shows limit orders waiting to trade at each price. The tape shows trades that already happened. The book is intent and can change at any time; the tape is a record of execution.
What does a green or red trade mean on the tape?
Green means the buyer was the aggressor and a market buy filled against an ask. Red means the seller was the aggressor and a market sell filled against a bid.
What is absorption in order flow?
Absorption is when aggressive orders keep hitting a level but price does not move through it, because passive orders at that level keep getting filled and refilled. It often marks a level that a larger participant is defending.
Is order book data reliable?
It is accurate for what is resting at that moment, but orders can be cancelled before they trade. Combine the book with the tape and with a liquidity heatmap to see whether size is real and persistent.
Do I need order flow to trade crypto?
No, but it helps with timing. Most traders use structure and risk management to decide what to trade and order flow to decide when to act. This is market education, not financial advice.