Short answer: a liquidity heatmap shows limit orders that are really sitting in the order book, recorded over time. A liquidation heatmap shows estimated price levels where leveraged long or short positions would be force-closed, calculated from open interest, leverage and entry assumptions. The first is observed data; the second is a model. Liquidity tells you where size is waiting to trade. Liquidations tell you where forced orders could suddenly appear. Experienced crypto traders use both, because price is often drawn toward liquidation clusters and then reacts at real liquidity.
Why the two get confused
Both charts look similar: price on one axis, time on the other, bright colours where "something big" is. Both are popular in crypto. And both are often shown as "the heatmap". But they answer different questions, and mixing them up leads to bad decisions, like treating a modelled liquidation cluster as a wall of real orders.
Liquidity heatmap: what is actually in the book
A liquidity heatmap is built by recording the order book continuously and drawing each price level's resting size as a colour.
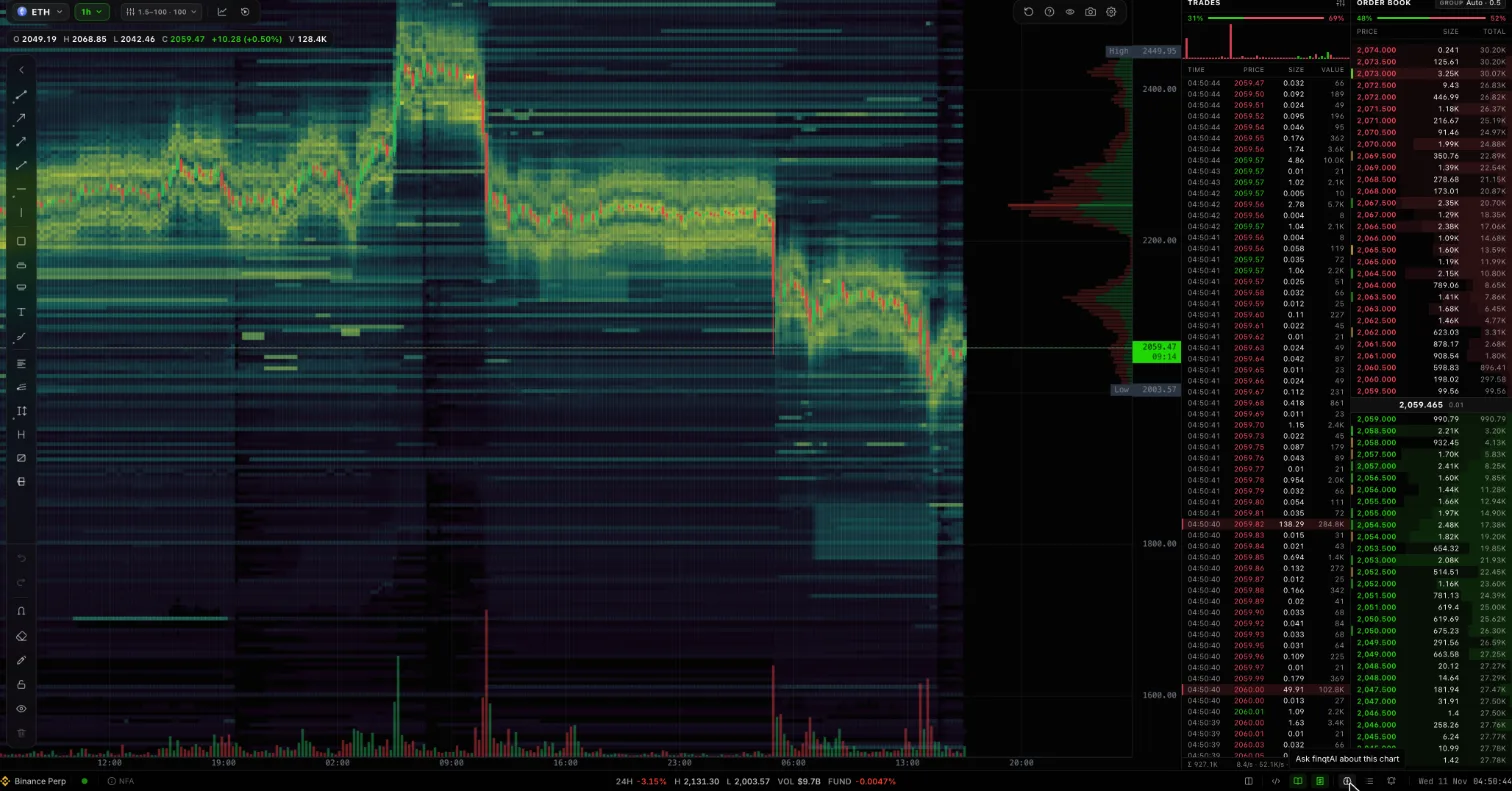 A liquidity heatmap on ETHUSDT (1h). Every bright cell is real resting size that was in the order book at that time
What it tells you:
- Where size is resting right now and where it was in the past.
- Whether that size is persistent or pulled. Orders that disappear before price arrives are a signal on their own.
- Where price can move fast. Dark, thin areas offer little resistance to market orders.
What it cannot tell you: it only shows limit orders that were placed. Stop orders and liquidation orders are invisible until they trigger, because exchanges do not publish them.
For a full walkthrough, see how to read a liquidity heatmap.
Liquidation heatmap: where forced orders could appear
A liquidation heatmap is a model. It starts from data that is public (open interest changes, price, funding, sometimes on-chain positions) and estimates where traders who opened leveraged positions would hit their liquidation price.
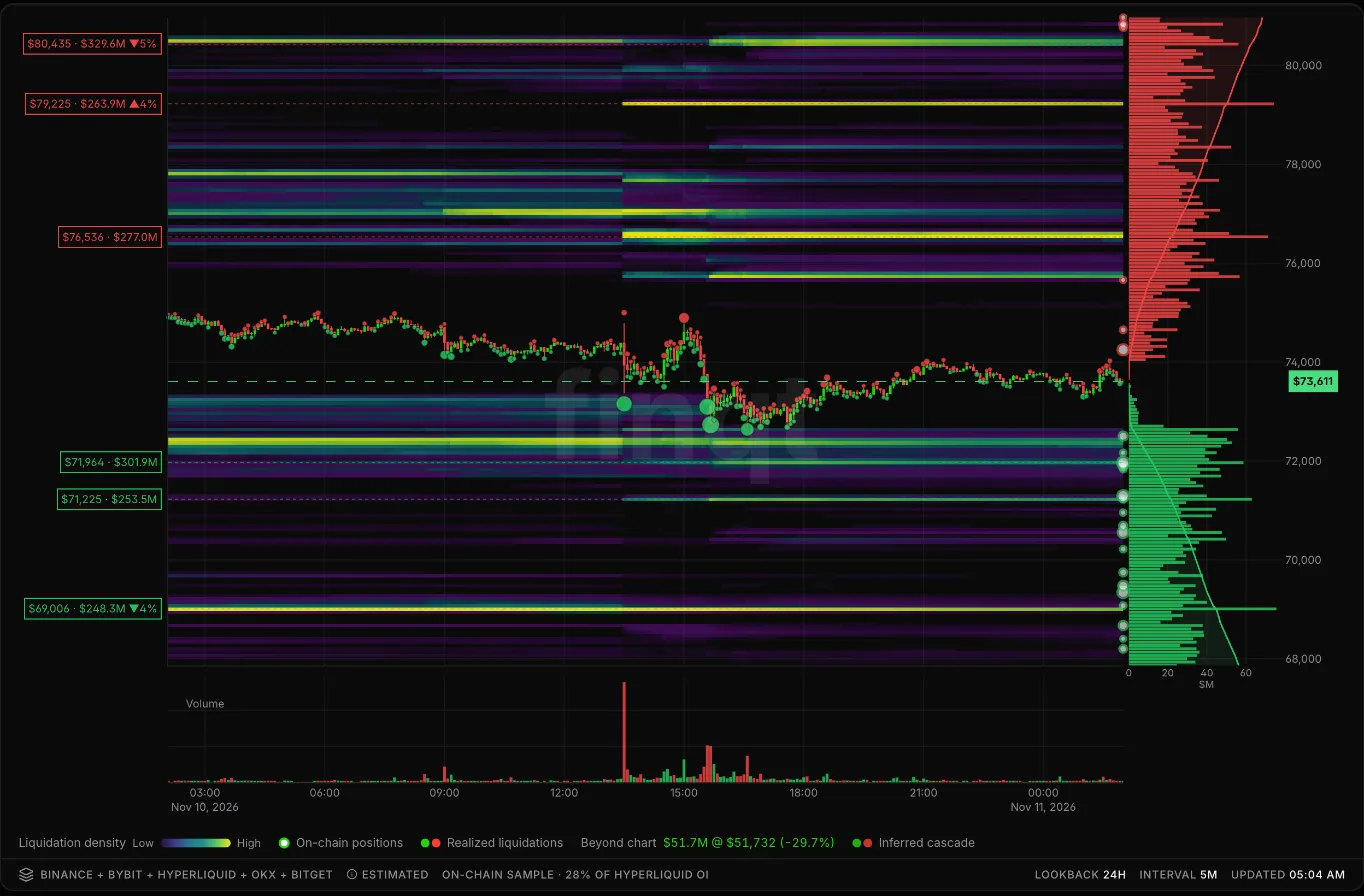 finqt liquidation heatmap for BTC (24h). Bright horizontal bands are modelled liquidation clusters; labels on the left show the price and size of the largest ones
What it tells you:
- Where clusters of leveraged positions probably sit. A bright zone above price means many shorts would be liquidated there; below price, many longs.
- Where a cascade could start. Forced market orders can push price into the next cluster, which is why liquidation-driven moves can be violent.
A good liquidation view also tells you how far each cluster is and how much sits on the way. In finqt the liquidation ladder lists the key levels above and below price with their estimated size, and the sweep curve shows how much would liquidate if price moved a given percentage, split by leverage.
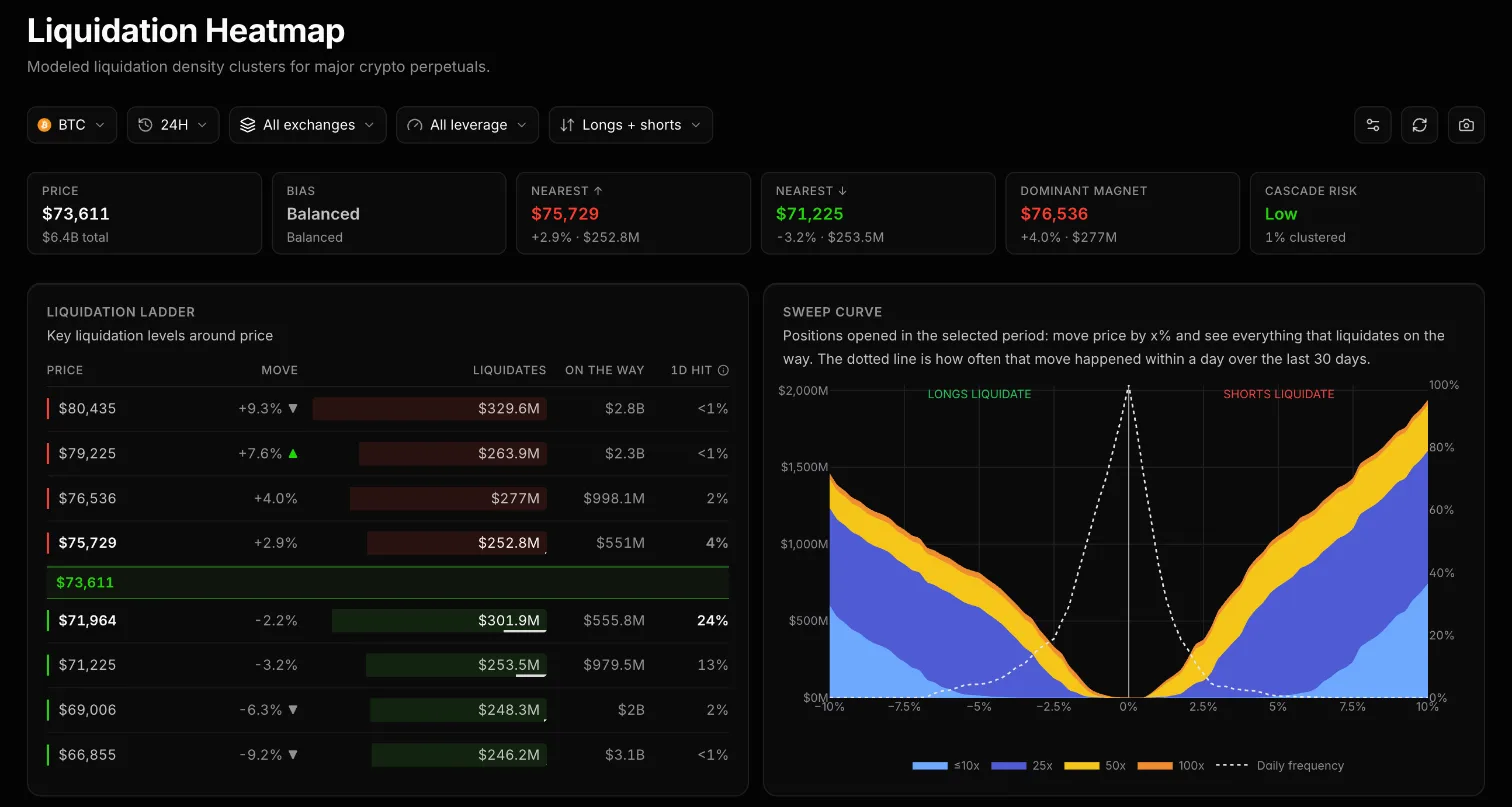 finqt liquidation ladder and sweep curve for BTC: key levels with estimated size, and how much liquidates for each % move, split by leverage
What it cannot tell you: exact positions. Leverage, entry prices and margin modes are estimated, so two providers can show different clusters for the same coin. Treat it as a probability map, not a list of orders.
Side-by-side comparison
| Liquidity heatmap | Liquidation heatmap | |
|---|---|---|
| Source | Recorded order book | Model from open interest, price, leverage |
| Shows | Real resting limit orders | Estimated forced-close levels |
| Changes when | Orders are placed, pulled or filled | Positions open, close or get liquidated |
| Best for | Reaction zones, stops, absorption | Spotting cascade risk and magnet levels |
| Main risk | Orders can be pulled (spoofing) | Model assumptions can be wrong |
| Markets | Spot and derivatives | Leveraged derivatives only |
How to use them together
A practical workflow:
- Start with liquidations on a higher timeframe to see where leveraged positions are crowded. These zones often act as magnets because hitting them releases forced orders.
- Switch to the liquidity heatmap to see whether real resting size sits near those zones. A liquidation cluster just beyond a thin area is more likely to be reached than one behind a thick band of bids.
- Watch the tape when price arrives. A spike in market orders with little price progress means liquidity is absorbing the flow; a spike with fast price movement means the forced orders won.
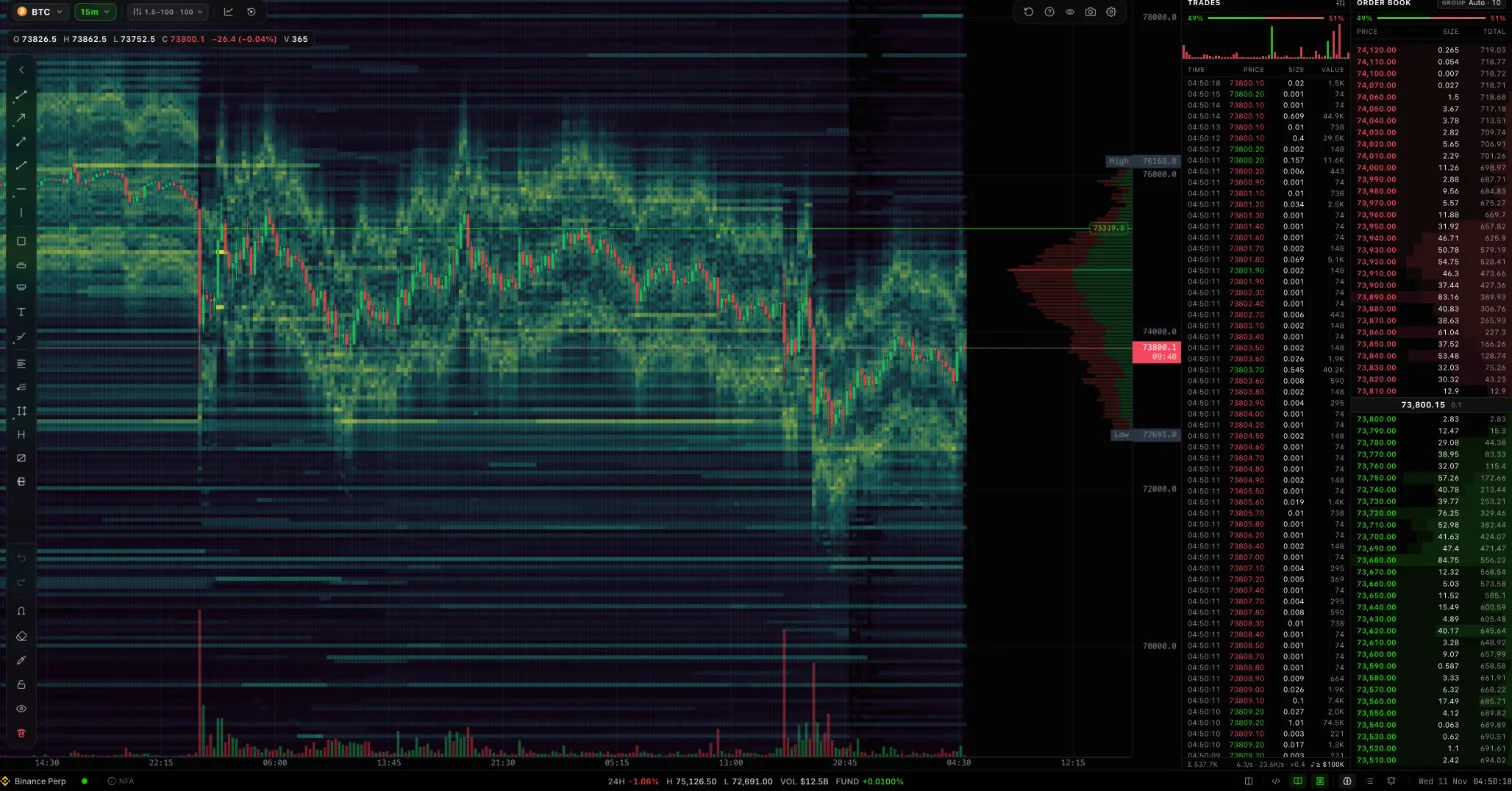 The finqt liquidity view on BTCUSDT: heatmap, volume profile, trades tape and order book in one screen
Where to find both in finqt
finqt records order books for the most liquid symbols on Binance futures, Binance spot and Bybit, so the web app liquidity view shows real history rather than only what your browser saw since the page opened. The liquidation heatmap models clusters for major perpetuals across Binance, Bybit, OKX, Bitget and Hyperliquid, and samples real on-chain Hyperliquid positions to anchor the estimate. Both views can be discussed with finqtAI in plain language.
Frequently asked questions
What is the difference between a liquidity heatmap and a liquidation heatmap?
A liquidity heatmap shows real limit orders resting in the order book over time. A liquidation heatmap estimates the price levels where leveraged positions would be force-closed. One is recorded data, the other is a model.
Which is more accurate?
A liquidity heatmap is more accurate about what was in the book, because it is recorded, but orders can be pulled at any time. A liquidation heatmap is an estimate whose accuracy depends on leverage and entry assumptions.
Why does price move toward liquidation clusters?
When price reaches a cluster, leveraged positions are closed with market orders. Those forced orders push price further, which can trigger the next cluster. Traders who know this sometimes push price toward crowded levels on purpose.
Can I see stop-loss orders on a liquidity heatmap?
No. Exchanges do not publish stop orders, so they do not appear in the order book until they trigger. A liquidity heatmap shows limit orders only.
Do liquidation heatmaps work for spot markets?
No. Liquidations only exist where there is leverage, which means perpetual futures and margin products. Spot markets have liquidity but no liquidations.