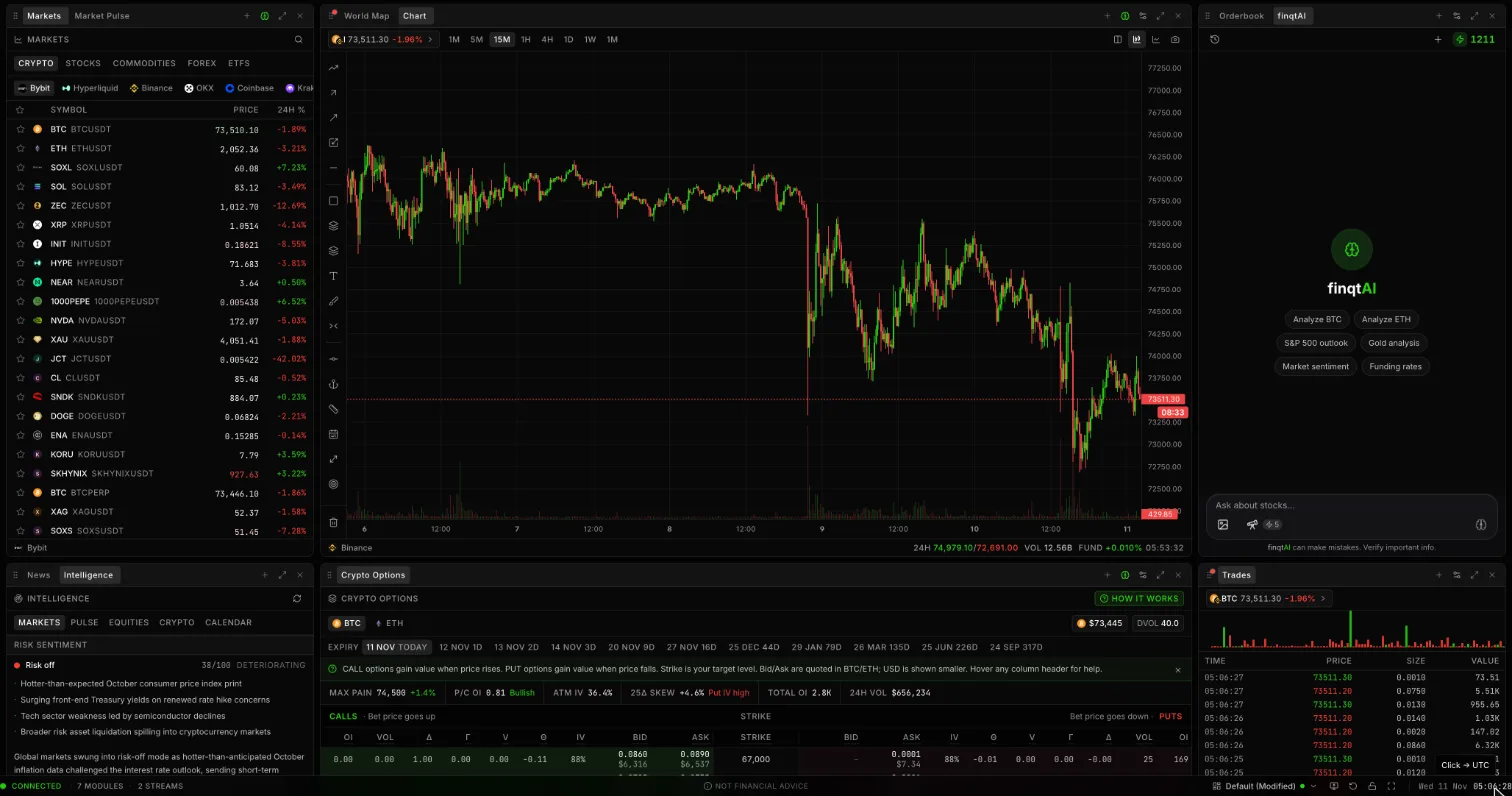
Most dashboards are too impressive and not useful enough.
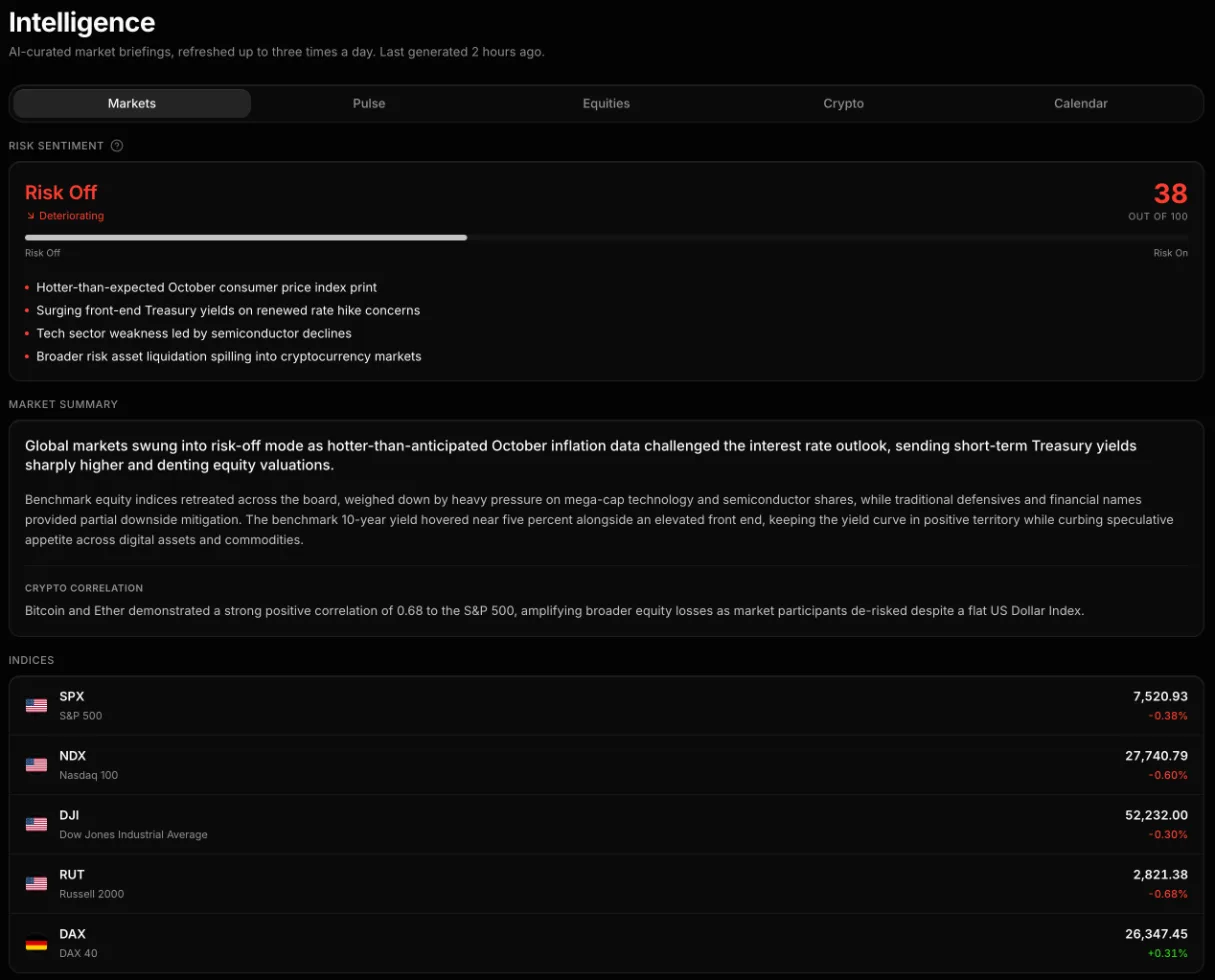 finqt Intelligence: a single risk score with the drivers behind it and cross-asset context
They fill the screen with charts, heatmaps, tickers, ratios, calendars, headlines, and gauges. They look professional. They feel like command centers. Then the market starts moving and nobody knows which panel matters.
A real risk dashboard has a smaller job.
It should tell you whether capital is seeking risk, hiding from risk, or rotating from one pocket of the market to another. That is it. If the dashboard cannot answer that question quickly, it is decoration.
This is a practical framework for building a multi-asset risk dashboard inside a live market workspace.
Start with the risk question
The core question is not "What is everything doing?"
The core question is:
"Is the environment helping or hurting the kind of risk I am taking?"
That wording matters. A long-term dividend investor, a crypto momentum trader, and a global macro investor do not need the same dashboard. The right signals depend on the risk you actually carry.
Still, most active investors need a view across five layers:
- Equity risk. Are stocks broadly being bought or sold?
- Rates. Is the cost of capital rising or falling?
- Currency. Is the dollar tightening or loosening global conditions?
- Credit or liquidity. Is stress showing up beneath the surface?
- Crypto and high beta. Are speculative assets confirming risk appetite?
No single layer tells the whole story. The dashboard is useful because it shows when the layers agree and when they conflict.
Layer 1: equity breadth
The index headline is not enough.
An index can rise because five megacaps are strong while the average stock is weak. It can fall because one crowded sector is being sold while the rest of the market is stable. Breadth tells you whether participation is broad or narrow.
Useful breadth signals include:
- Advancers versus decliners
- Equal-weight indexes versus cap-weighted indexes
- Sector performance
- New highs versus new lows
- Small caps versus large caps
If the S&P 500 is up but breadth is poor, the rally may be narrower than it looks. If the index is flat but breadth improves, risk appetite may be building quietly.
Breadth is not a signal by itself. It is a quality check on the headline move.
Layer 2: rates and the cost of capital
Rates sit underneath almost every risk asset.
When yields rise quickly, long-duration assets tend to feel pressure: growth stocks, speculative tech, crypto, and companies whose cash flows sit far in the future. When yields fall for healthy reasons, risk assets often get more breathing room. When yields fall because growth is breaking, the message is different.
That is why a dashboard should show rates with context, not as a random line chart.
Watch:
- Short-term yields for policy expectations
- Long-term yields for growth and inflation expectations
- The shape of the curve
- Rate-sensitive sectors like banks, utilities, and real estate
The question is not simply "Are yields up or down?" The question is "Why are yields moving, and which assets should care?"
Layer 3: the dollar and global pressure
The US dollar is one of the cleanest global risk signals.
A strong dollar often tightens conditions for non-US markets, commodities, emerging markets, and parts of crypto. A weaker dollar can ease pressure and support global risk appetite. The relationship is not mechanical, but it is too important to ignore.
Add the dollar to the dashboard next to global equity indexes and major commodities. You are looking for confirmation or tension.
Examples:
- Dollar up, emerging markets down, crypto weak: global risk is under pressure.
- Dollar down, global equities broadening, commodities firm: risk appetite may be improving.
- Dollar up, US megacaps up, everything else weak: leadership may be narrow and fragile.
Again, the point is not prediction. The point is situational awareness.
Layer 4: crypto as high-beta confirmation
Crypto often behaves like a high-beta liquidity gauge.
That does not mean every crypto move is macro. Protocol news, ETF flows, token unlocks, leverage, and venue-specific events matter. But when Bitcoin, Ethereum, and high-beta tokens move together with growth stocks and risk-sensitive assets, the message is worth noticing.
For a risk dashboard, separate crypto into three reads:
- Bitcoin. The cleanest institutional liquidity proxy in crypto.
- Ethereum. Often a bridge between large-cap crypto and ecosystem risk.
- High beta. Solana, AI tokens, meme assets, or whatever segment currently expresses speculation.
If equities rally but crypto does not confirm, the rally may be more defensive than it looks. If crypto breaks first while equities are still quiet, risk appetite may be changing before it shows up in the stock indexes.
Do not overread every tick. Look for alignment.
Layer 5: your own exposure
The most important panel is not the market. It is your book.
A dashboard that does not connect to your actual exposure is incomplete. You need to know whether the risk environment matches what you own or watch.
Ask:
- Am I concentrated in one theme?
- Do my positions all depend on the same macro condition?
- Am I long high beta while liquidity signals are deteriorating?
- Am I holding defensive assets while breadth is improving?
- Which position would hurt most if the current risk signal is right?
This is where portfolio tracking and live market context belong together. A risk dashboard should not just show what the world is doing. It should show what the world is doing to you.
Keep the layout boring
The best risk dashboard is easy to scan.
Put the slowest, broadest signals at the top: indexes, breadth, rates, dollar. Put sector and theme rotation in the middle. Put high-beta confirmation and your own exposure closer to the action area.
Avoid ten versions of the same signal. If three panels all say "growth risk," pick the one you trust most. Redundancy makes dashboards feel robust, but it often just makes decisions slower.
A clean layout might be:
- Top row: S&P 500, NASDAQ, Russell 2000, global equities
- Second row: yields, dollar, oil, gold
- Third row: sector heatmap, breadth, volatility
- Fourth row: BTC, ETH, high-beta crypto, your risk-heavy watchlist
- Side panel: portfolio exposure and active alerts
Inside finqt, the terminal/workspace model is built for exactly this kind of arrangement: live charts, watchlists, market intelligence, alerts, and portfolio context in one place.
The signal is alignment
A risk dashboard is not useful because one chart flashes red.
It is useful when several independent layers start saying the same thing.
Risk-on alignment might look like:
- Breadth improving
- Yields stable or falling for healthy reasons
- Dollar softening
- High-beta assets confirming
- Your watchlists breaking out on volume
Risk-off alignment might look like:
- Breadth weakening
- Yields rising fast or falling for bad reasons
- Dollar strengthening
- Crypto and small caps lagging
- Alerts firing on downside levels across unrelated assets
Mixed signals are common. They are not a failure. They are information. Mixed signals usually mean size down, wait for confirmation, or stop pretending the market is clear.
The dashboard should change your behavior
If a dashboard does not change behavior, it is wallpaper.
A useful risk dashboard should help you:
- Decide whether to press or reduce risk
- Notice when a move is broad or narrow
- See when your positions share one hidden dependency
- Turn alerts into review points instead of panic buttons
- Write cleaner journal notes about market regime
The goal is not to watch more. The goal is to understand faster.
Markets move before the headline is obvious. A good dashboard will not predict every turn, but it will show when the environment around your decisions is changing.
That is enough to matter.