Order flow
What is an orderbook heatmap and how to read it.
See where limit orders are really resting in the order book and how that liquidity moves over time. The finqt orderbook heatmap turns order book depth into a chart you read next to price.
The orderbook heatmap opens after you sign in to finqt.
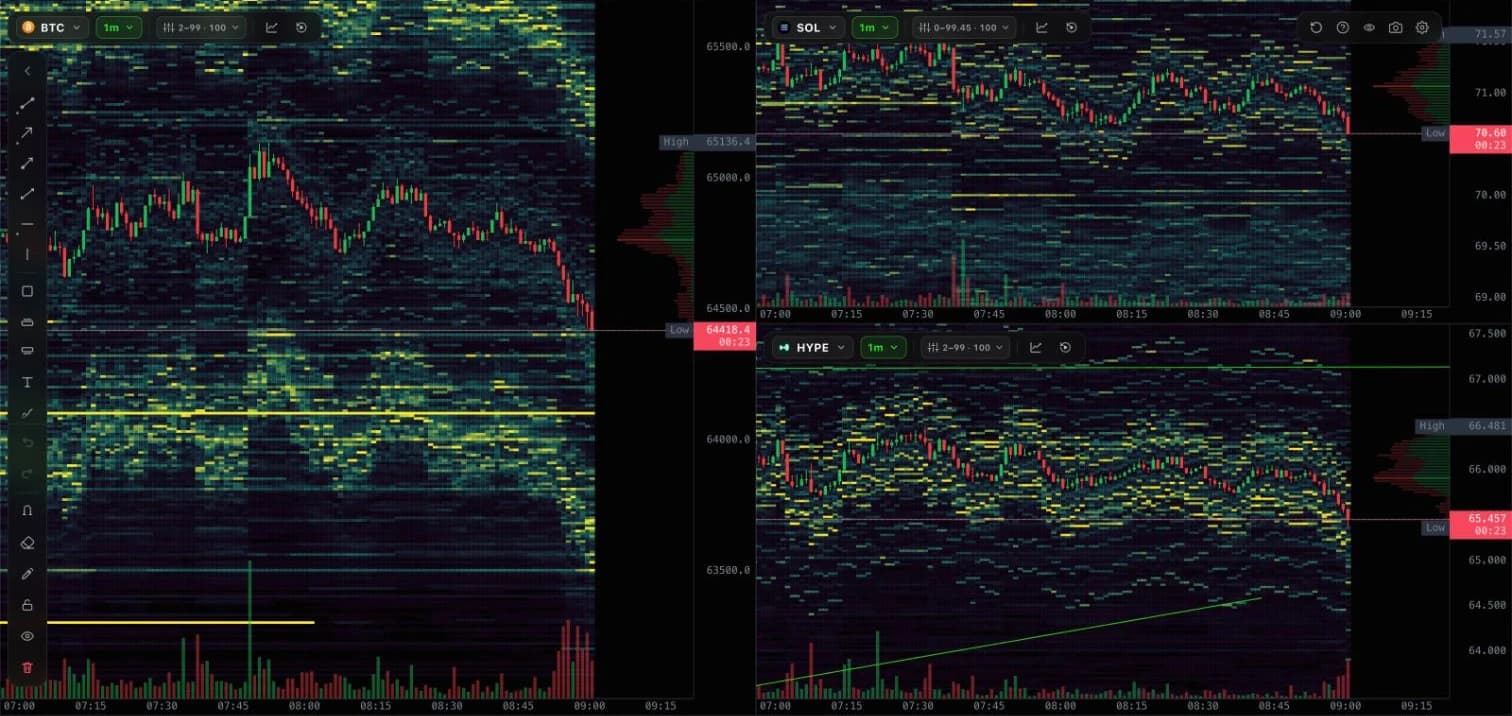
What an orderbook heatmap shows
An orderbook heatmap, also called a liquidity heatmap, plots the order book over time. Price is on the vertical axis, time on the horizontal axis, and the colour of each cell shows how much size was resting at that price at that moment.
Unlike a liquidation heatmap, this is observed data: the orders were really in the book.
Reading the chart
How traders read an orderbook heatmap
Bright bands are walls
Bright horizontal bands are large limit orders that stayed in the book. Price tends to slow down or react when it reaches them.
Dark areas are thin
Dark areas mean little resting liquidity. Price can move through them fast.
Liquidity can be pulled
Orders can be cancelled before price arrives. A band that disappears is information too, so traders watch how walls behave, not only where they sit.
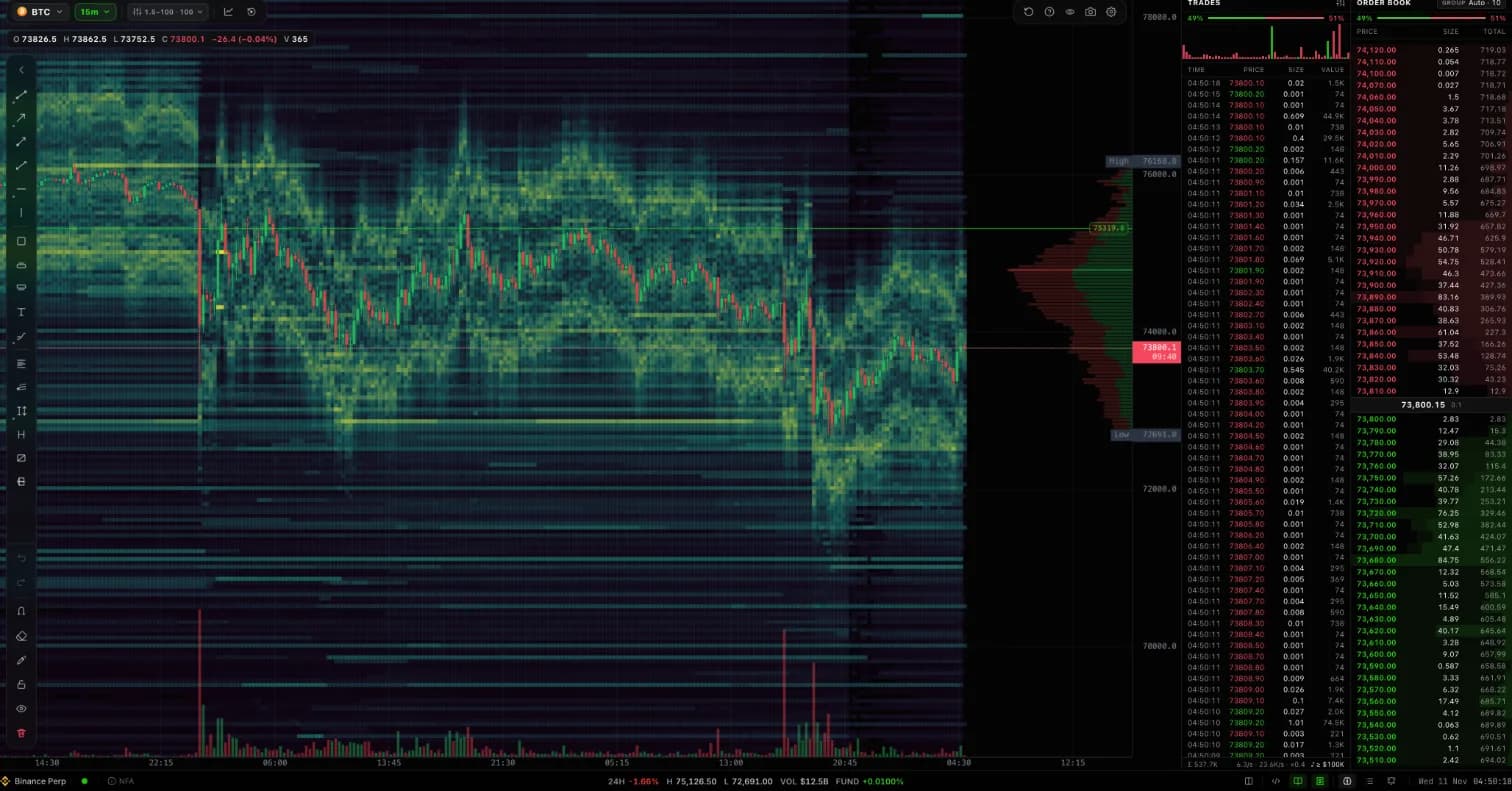
How it works
How the finqt orderbook heatmap works
Order book depth
finqt records the bids and asks resting in the order book at each price level.
Recorded over time
Each snapshot is kept, so you see how liquidity built up, moved or vanished, not only the current book.
Drawn with price
Depth is coloured by size and drawn on the same axis as price, so walls and gaps line up with the chart.
FAQ
Orderbook heatmap questions
Related tools
Keep exploring
Market data and models are for research only and are not financial advice.