Crypto derivatives
What is a liquidation heatmap and how to read it.
See where leveraged longs and shorts would probably be force-closed. The finqt liquidation heatmap estimates liquidation clusters from open interest and common leverage tiers on Binance, Bybit and Hyperliquid.
Free live preview at lower resolution for 10 coins, no sign-up needed. The full map in higher detail opens with a free finqt account.
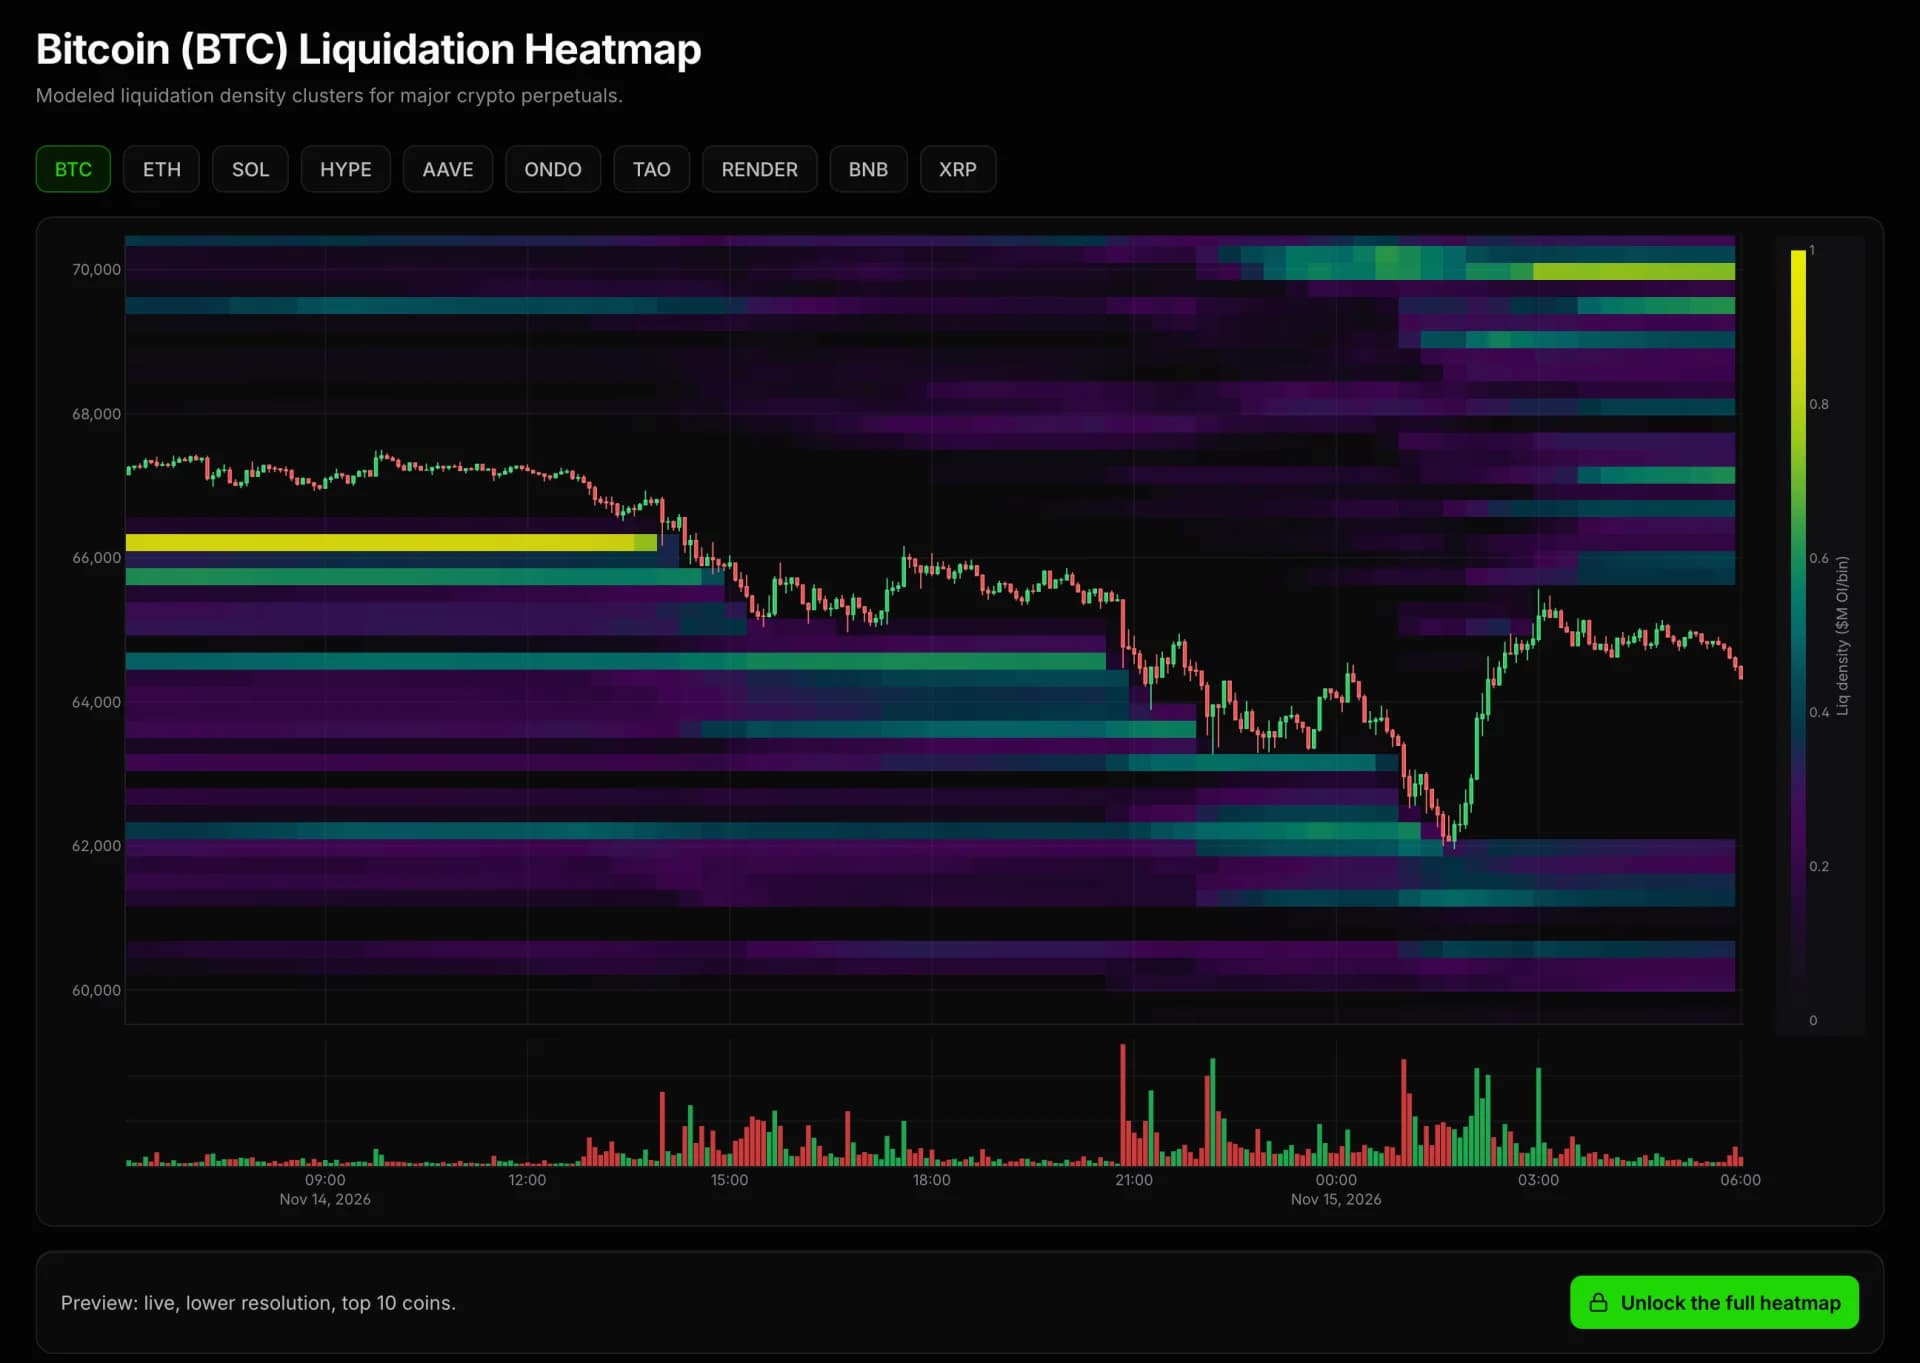
What a liquidation heatmap shows
A liquidation heatmap puts price on the vertical axis and time on the horizontal axis. The brighter a band, the more leveraged positions are estimated to be liquidated at that price.
It is a model, not a list of real orders. Use it to see where forced buying or selling could pile up, not as exact price targets.
Reading the chart
How traders read a liquidation heatmap
Bands above price
Bright bands above the current price are clusters of estimated short liquidations. If price reaches them, shorts are force-closed with market buys.
Bands below price
Bright bands below the current price are clusters of estimated long liquidations. Reaching them triggers forced market sells.
Clusters pull price
Price is often drawn toward large clusters, because the forced orders they release can push it further. Traders treat them as risk zones and possible reaction areas.
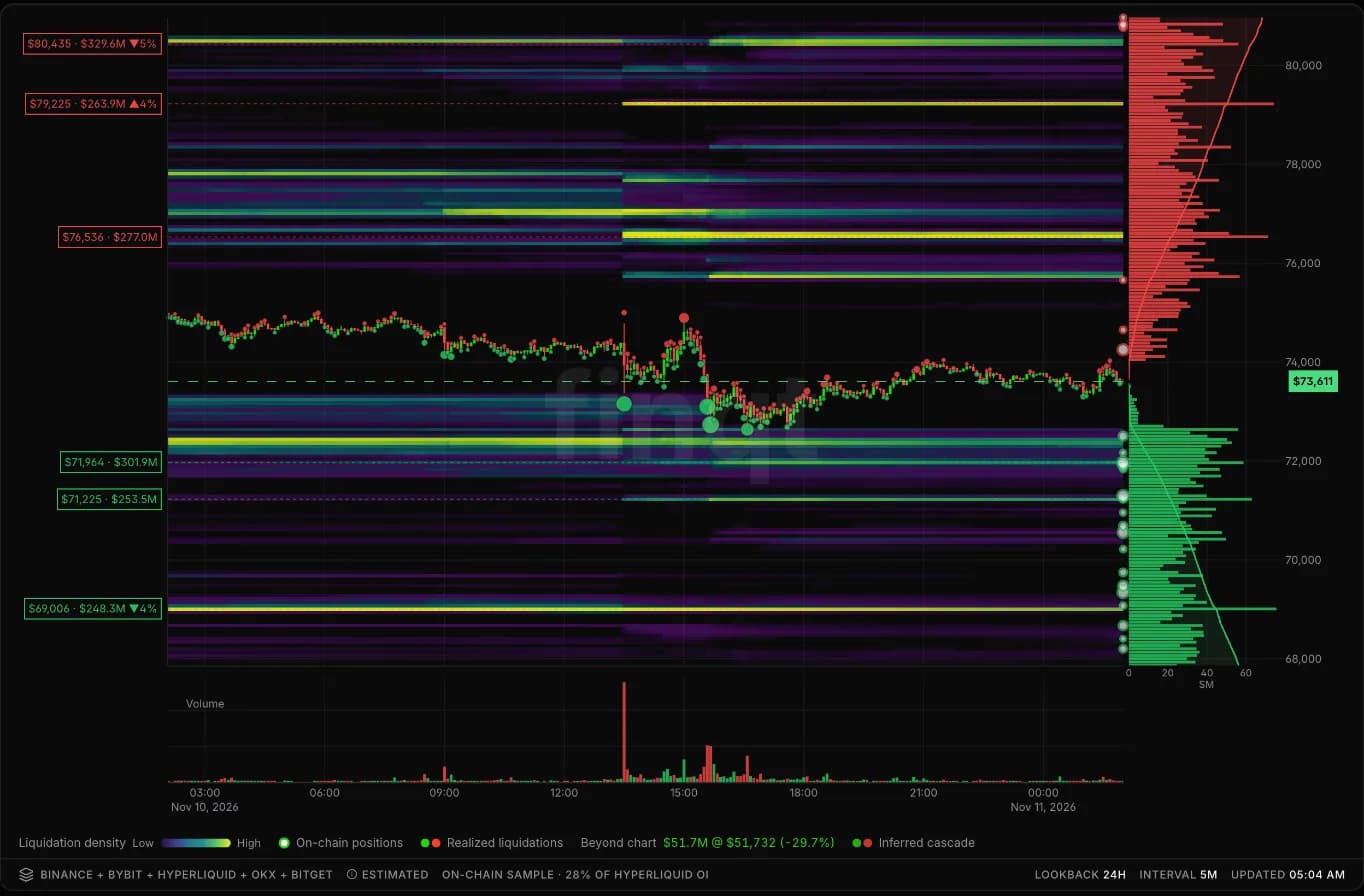
How it works
How the finqt liquidation heatmap works
Open interest
The model starts from open interest on Binance, Bybit and Hyperliquid.
Leverage tiers
Positions are spread across common leverage tiers to estimate the price at which each group would be liquidated.
Clusters on the chart
The estimated levels are stacked into bands next to price, so the largest clusters are easy to spot.
By coin
Liquidation heatmap by coin
The free live preview covers these 10 coins. Each link opens the live map on app.finqt.com.
FAQ
Liquidation heatmap questions
Related tools
Keep exploring
Market data and models are for research only and are not financial advice.