Crypto derivatives
What are liquidation levels and how to read them.
A liquidation level is the price at which a leveraged position is force-closed. finqt estimates where those levels cluster for longs and shorts and shows them on the liquidation heatmap.
Liquidation levels are shown on the finqt liquidation heatmap: free live preview at lower resolution for 10 coins, full map in higher detail with a free account.
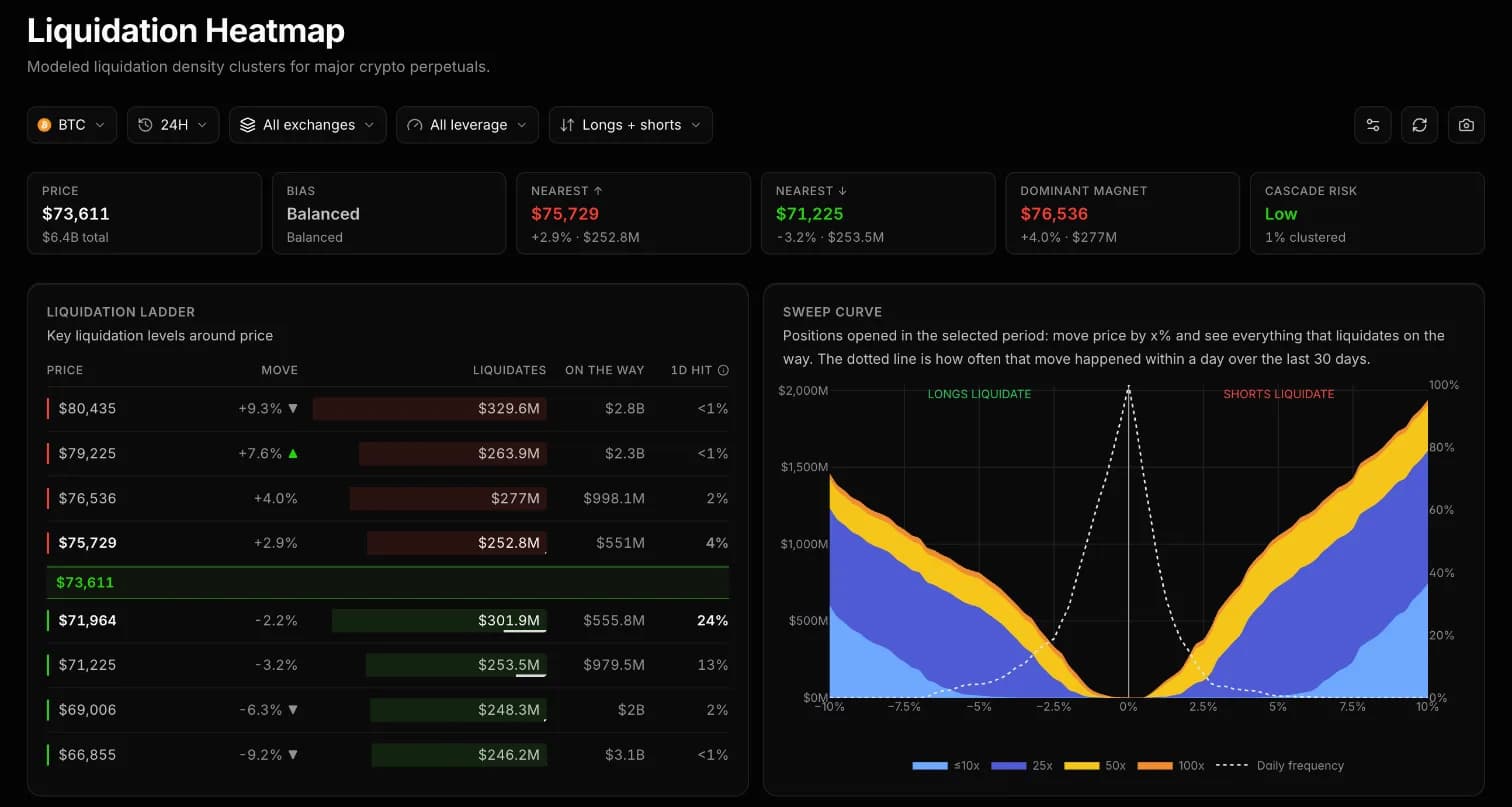
What liquidation levels are
When a leveraged position loses so much that its margin no longer covers it, the exchange closes it at market. The price where that happens is the liquidation level. The higher the leverage, the closer that level sits to the entry price.
Nobody outside the exchange sees every trader's position, so public liquidation levels are estimates. They are not resting orders.
Reading the chart
How traders use liquidation levels
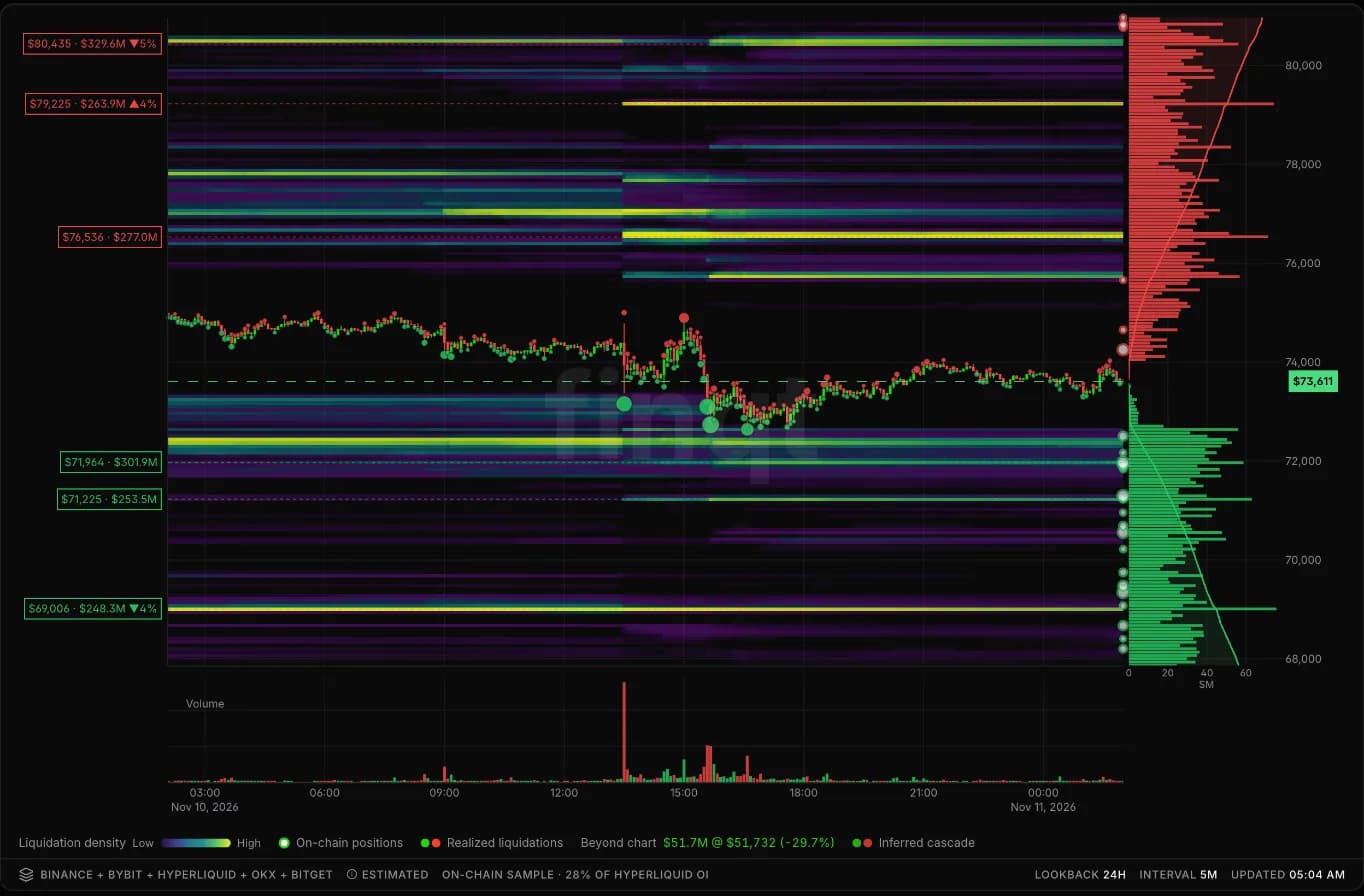
Long levels sit below price
Estimated long liquidation levels are below the current price. A drop into them forces market sells.
Short levels sit above price
Estimated short liquidation levels are above the current price. A rise into them forces market buys.
Clusters matter most
A single level means little. Traders look for prices where many estimated levels stack up, because that is where forced orders could be largest.
How it works
How finqt estimates liquidation levels
Open interest
The estimate starts from open interest on Binance, Bybit and Hyperliquid.
Leverage tiers
Common leverage tiers are applied to work out where each group of positions would be liquidated.
Levels on the heatmap
The levels appear as clusters on the liquidation heatmap, where the largest ones are easy to spot.
By coin
Liquidation levels by coin
Liquidation levels do not have their own page on the app yet. These links open the liquidation heatmap for each coin, where the levels are shown.
FAQ
Liquidation levels questions
Related tools
Keep exploring
Market data and models are for research only and are not financial advice.