Short answer: open interest (OI) is the number of derivative contracts that are still open. It is not volume, and it is not a buy or sell signal on its own. When OI rises, new positions are being opened; when it falls, positions are being closed. The useful read comes from putting that change next to price and the funding rate. On finqt, you can see open interest on each crypto perpetual's market page, screen coins by OI in the web app, and use OI as the raw input behind the liquidation heatmap.
What open interest measures (and what it does not)
Open interest counts outstanding contracts. In a perpetual futures market, every long has a matching short, so one contract is one open long and one open short counted once, not twice.
OI does not tell you who is right. A rising number only tells you that more capital is sitting in open positions. It does not tell you which direction to take, and it does not tell you whether those positions are well placed.
It also does not equal market cap, and it is not a simple count of "money in the market." Venues report OI in contracts or in coin terms; the notional value then depends on the mark price. A coin can show a large notional OI simply because its price is high.
Open interest vs volume: a worked example
Volume measures how much traded over a period. Open interest measures how much remains open at a point in time. The same volume can raise, lower, or leave OI unchanged, depending on whether the trade opened a new position, closed an existing one, or passed a position to a new holder.
Suppose a perpetual starts the hour with 20,000 contracts of open interest:
- Trader A opens 100 contracts long and trader B takes the other side. Volume is 100 contracts; open interest becomes 20,100.
- Later, A sells those 100 contracts to trader C. Volume is another 100 contracts; open interest stays 20,100, because the long simply changed hands.
- Then C and B both close. Volume is another 100 contracts; open interest returns to 20,000.
In notional terms the arithmetic is the same. If each contract is worth $50,000, those 100 contracts are $5,000,000 of notional (100 × $50,000). Open interest rose by $5 million in the first step, not $10 million, because the long and the short are two sides of the same contract.
If you only watch volume, those three hours look identical. Open interest is what tells them apart.
How to read price and open interest together
A common, conservative framework looks at the two together. Treat it as a way to describe positioning, not as a trading rule.
- Price up, OI up. New positions are being opened as price rises. The move is attracting fresh capital. That can continue, but it also means more leverage is now in the market.
- Price up, OI down. Positions are being closed into the rally. A typical case is shorts buying back (a short-covering move). The tape can still look strong while the outstanding book is shrinking.
- Price down, OI up. New positions are being opened as price falls, often fresh shorts or late longs. Crowding can build quickly.
- Price down, OI down. Positions are being closed on the way down, often longs exiting. Selling can remain heavy even as OI shrinks; the point is that the book is unwinding, not expanding.
None of these four cases is a buy or sell call. Two coins can print the same pattern for different reasons: a hedge, a basis trade, or a one-sided directional bet all add to OI in the same way. Use the framework to ask a better question, then check funding and the chart.
Read OI with the funding rate, not in isolation
Open interest tells you how large the book is. The funding rate tells you which side is paying to stay in it. Together they are more informative than either number alone.
- Rising OI with clearly positive funding often means longs are crowded and paying to stay long.
- Rising OI with negative funding often means shorts are crowded and paying to stay short.
- Falling OI after a spike in funding can mean the crowded side is being forced out.
Funding is usually quoted per 8 hours. A separate post walks through how to read funding across exchanges and how to convert it to APR. On finqt, each coin's market page lists funding next to open interest, so you can read the two without leaving the asset. The live funding table is also available from markets.
A worked pairing: if funding is +0.05% per 8 hours and open interest has been rising with price, longs are paying 0.05% × 3 = 0.15% a day, or 0.05% × 3 × 365 = 54.75% a year, roughly 55%. That is a real carrying cost. It does not mean price must reverse; it means the long side is expensive to hold.
Where to see open interest on finqt
Start with a specific market. A page such as Bitcoin on Binance shows the live price, 24-hour change and volume, the funding rate and open interest, plus a chart. The same layout is available on other venues, including Bybit, OKX and Hyperliquid. The markets table is the entry point if you want to browse first.
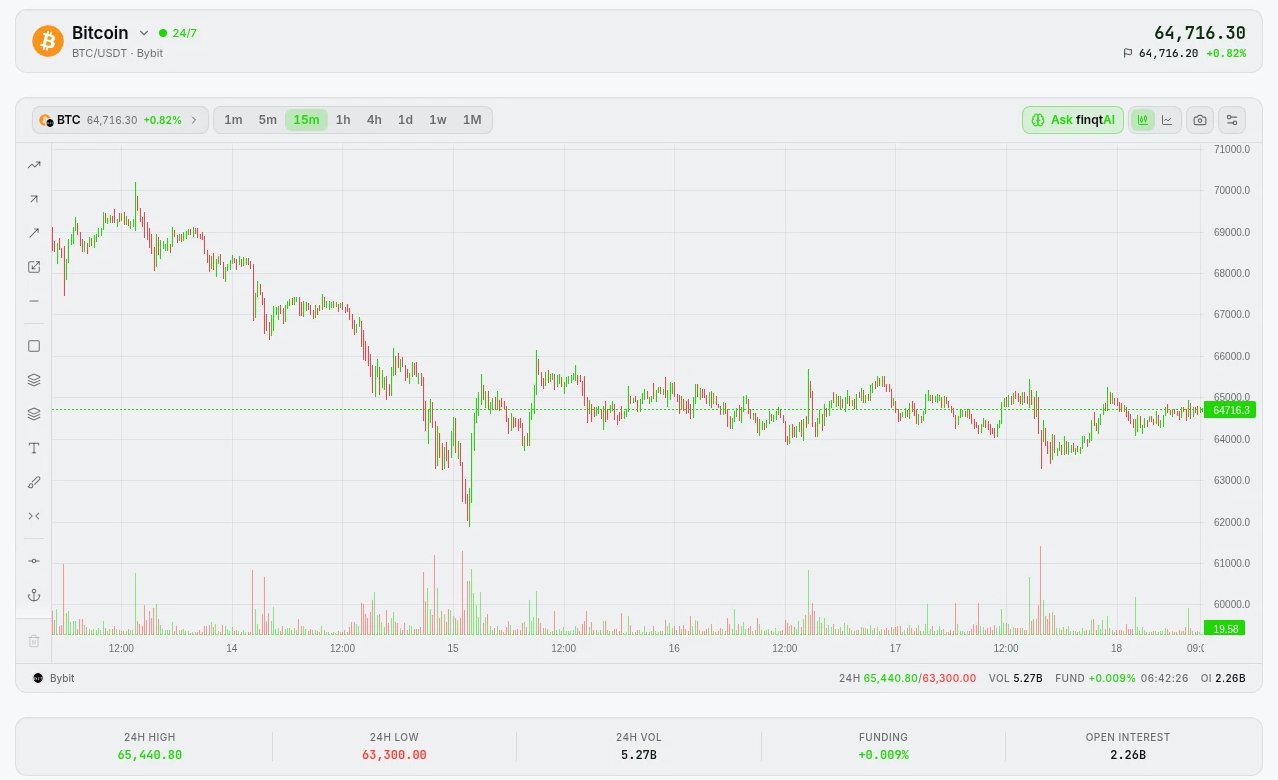 finqt BTC/USDT perpetual page on Bybit showing price chart, funding rate +0.009% and open interest of 2.26B
To compare many perpetuals at once, open the Crypto Screener in the finqt web app terminal. It screens live perps across Binance, Bybit, OKX and Hyperliquid with filters for volume, funding rate, open interest and range, plus presets. That is the practical way to find coins where OI is unusually large, or where OI and funding have moved together.
Open interest is also the raw input behind liquidation maps. The liquidation heatmap estimates where leveraged longs and shorts would likely be force-closed, using open interest and common leverage tiers. A separate post explains how to read that heatmap. OI tells you how large the book is; the heatmap estimates where that book might be vulnerable.
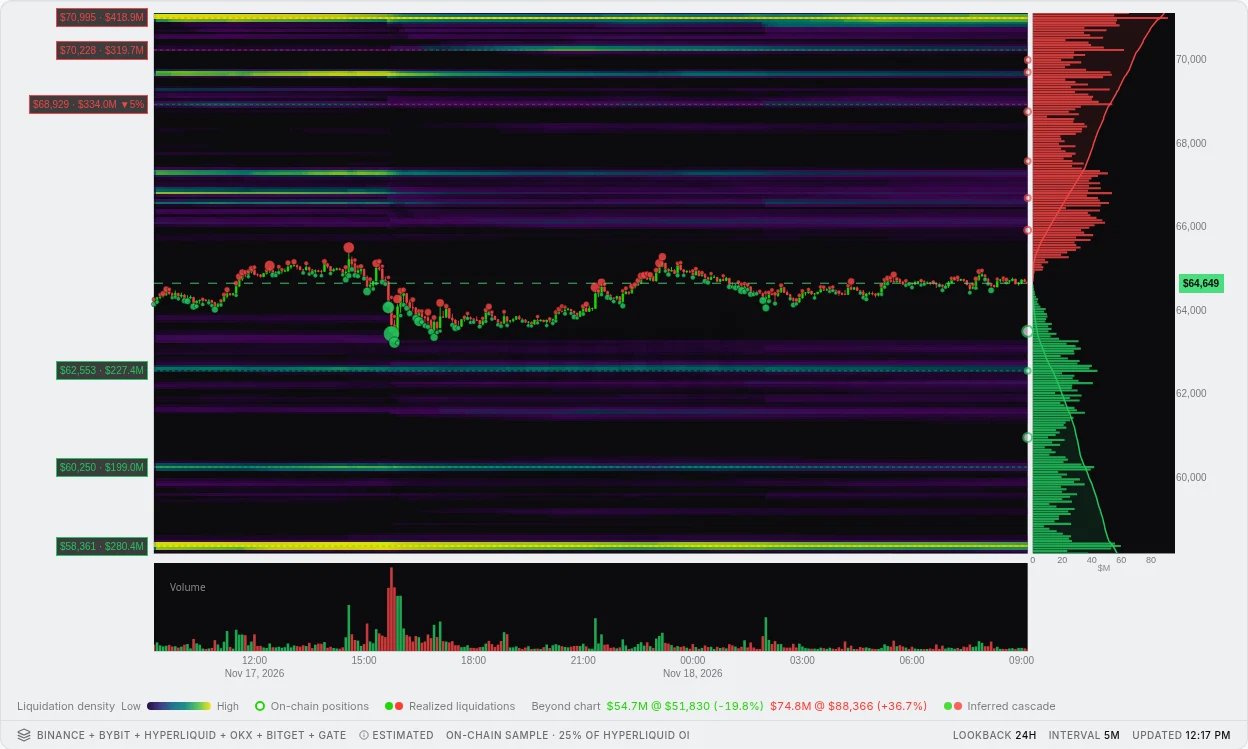 finqt 24-hour BTC liquidation heatmap showing estimated liquidation clusters above and below the current price
In the terminal, the OI by Strike widget (a PRO tool) shows the distribution of call and put open interest across strikes for a given expiry, with a max-pain overlay. That is options open interest, not perpetual futures OI, and it answers a different question: where option inventory sits into expiry, not how large the perp book is.
Common mistakes when you first look at OI
- Treating OI as volume. Volume can be high while OI is flat, and the other way around. Always check both.
- Comparing raw OI across coins without a scale. A large notional on Bitcoin is not the same story as a large notional on a thin altcoin. Compare OI to that coin's usual level, or to its own volume, rather than to every other market.
- Reading OI on one venue as the whole market. Positioning can be one-sided on a single exchange and quieter elsewhere. Look at more than one venue when the number matters.
- Assuming rising OI is bullish. New shorts raise OI too. Price direction and funding are what give the change a side.
- Expecting OI to predict the next candle. It describes the outstanding book. It does not forecast the next move.
If you want a short, repeatable habit: note the coin's open interest, whether it is rising or falling, the funding rate, and the 24-hour price change. Write those four numbers down before you reach for a conclusion.
Frequently asked questions
Is open interest the same as volume?
No. Volume is how much traded over a period. Open interest is how many contracts remain open. A busy hour can leave OI unchanged if most trades only transfer existing positions.
Does rising open interest mean price will go up?
No. Rising OI only means new positions are being opened. Those positions can be long or short. Read the change with price and funding, and treat it as context, not a forecast.
Why can open interest look different on two exchanges?
Each venue reports its own book. Liquidity, fees and the local funding rate all differ, so OI is not identical across Binance, Bybit, OKX and Hyperliquid. Compare venues instead of assuming one number is the global total. finqt market pages and the Crypto Screener are built so you can switch venue without leaving the workflow.
What is the difference between perpetual open interest and options open interest?
Perpetual OI is the outstanding futures book that never expires. Options OI is the outstanding book of calls and puts at specific strikes and expiries. On finqt, perpetual OI is on the coin's market page and in the Crypto Screener; options OI is in the OI by Strike widget.
Where can I see open interest on finqt?
Open a crypto perpetual from markets, for example BTC on Binance. The page lists open interest next to price, volume and funding. For a cross-coin view, use the Crypto Screener in the web app. For a map of where leveraged positions might be forced out, open the liquidation heatmap.