Short answer: a crypto liquidation heatmap shows the price levels where leveraged long and short positions would probably be force-closed. Bright bands above price are clusters of short liquidations; bright bands below price are clusters of long liquidations. Price is often drawn toward large clusters, because hitting them triggers forced market orders that push price further. The map is a model built from open interest and leverage, not a list of real orders, so use it to see where risk is concentrated, not as exact targets.
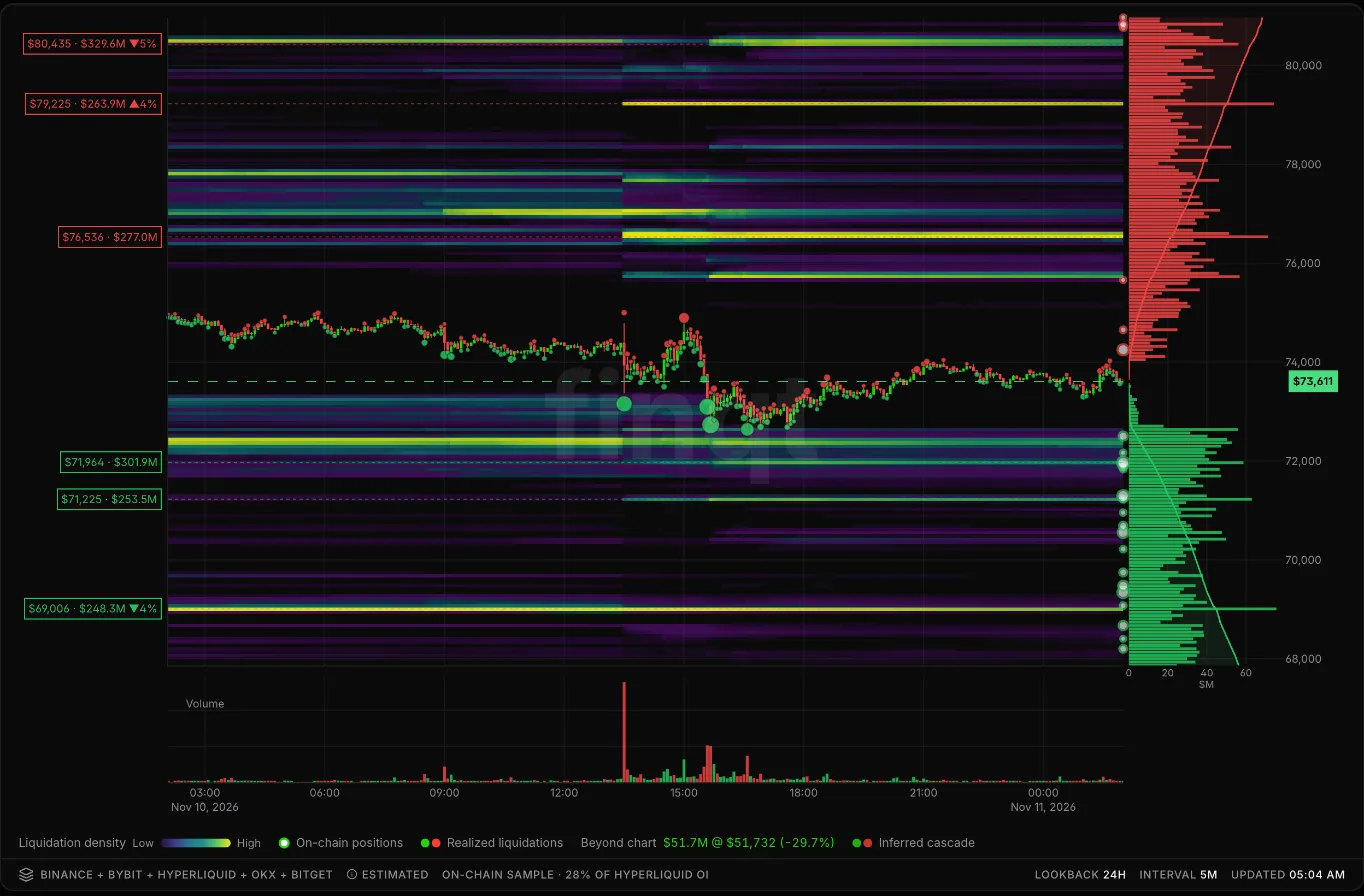 finqt liquidation heatmap for BTC over 24 hours: modelled clusters as bright bands, the largest levels labelled with price and size, and a profile of longs (green) and shorts (red) on the right
What you are looking at
- Bright horizontal bands are price levels where a lot of leveraged positions would be liquidated. Brighter means more estimated size.
- Labels on the left mark the biggest clusters with their price, estimated size and distance from the current price.
- The profile on the right totals estimated liquidations by price: red for shorts above, green for longs below.
- Dots on the candles mark realized liquidations that actually happened, and optional on-chain positions sampled from Hyperliquid, where liquidation prices are public.
finqt builds the map per exchange and pins each venue's model to its own open interest, then combines Binance, Bybit, OKX, Bitget and Hyperliquid. The page labels it "Estimated" on purpose: leverage and entry prices are inferred, not known.
The summary row: read it first
Above the map, finqt summarises what matters right now:
- Bias: whether more liquidation size sits above or below price.
- Nearest ↑ / Nearest ↓: the closest significant clusters on each side, with distance and size.
- Dominant magnet: the single largest nearby cluster.
- Cascade risk: how clustered liquidations are near price. High cascade risk means one move could trigger a chain reaction.
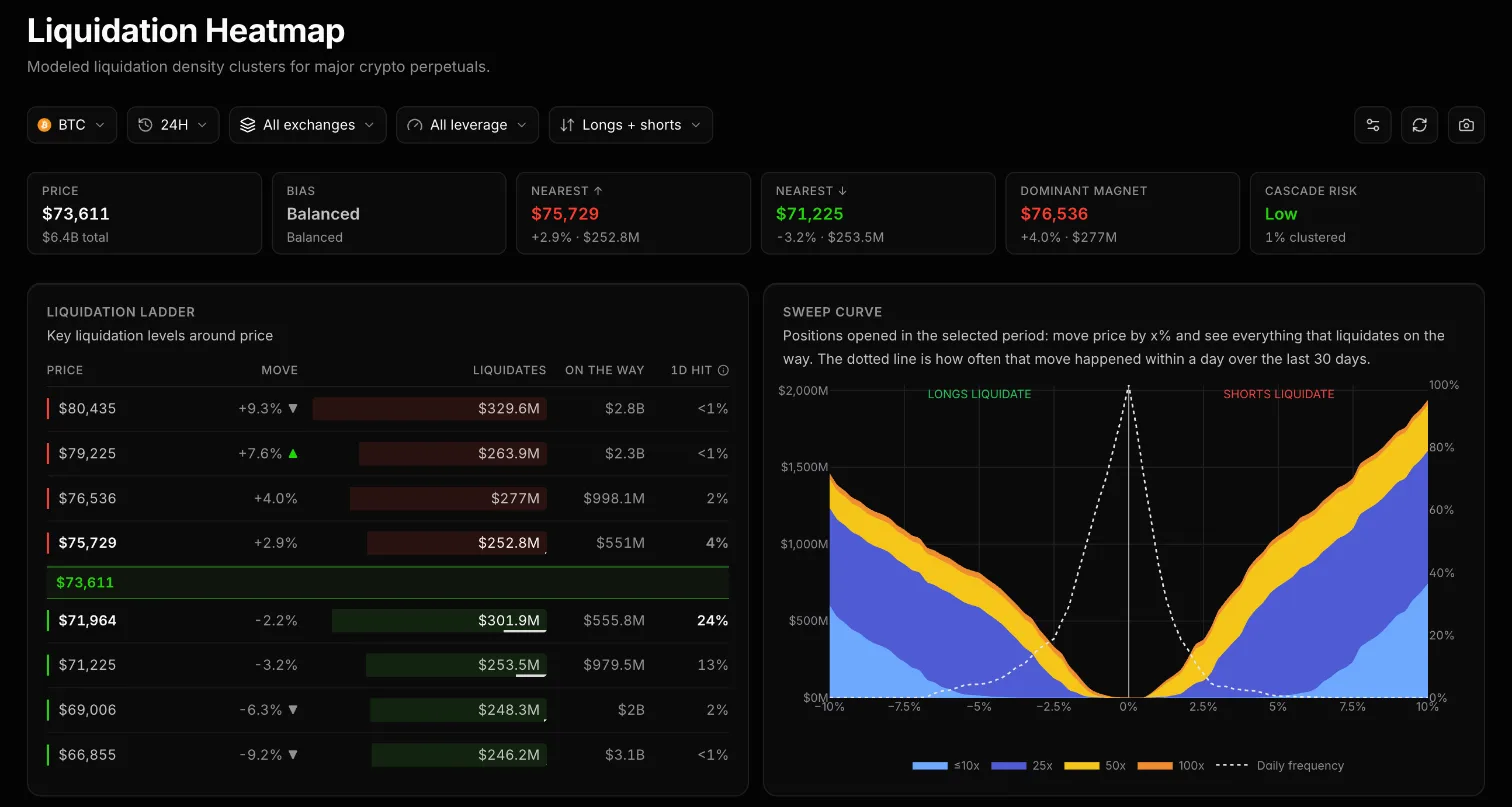 finqt liquidation summary, ladder and sweep curve for BTC: bias, nearest levels, dominant magnet, cascade risk, key levels with size and 1-day hit odds, and liquidations per % move by leverage
The liquidation ladder
The ladder lists key levels above and below price. For each one you see:
- Move: how far price has to travel to reach it.
- Liquidates: the estimated size at that level.
- On the way: everything that would liquidate between here and there. This is often more important than the level itself, because forced orders on the way can carry price through.
- 1D hit: how often a move that size happened within a day over the last 30 days. A big cluster with a 2% daily hit rate is less urgent than a medium one with 24%.
The sweep curve
The sweep curve answers one question: if price moves x% from here, how much gets liquidated? The left side is longs liquidating on a drop, the right side is shorts on a rally, stacked by leverage (≤10x, 25x, 50x, 100x). The dotted line shows how often each move happened in a day recently.
A steep curve close to zero means a small move liquidates a lot, which is when cascades happen. A flat curve means positioning is spread out.
How to use it
- Find the magnets. Large clusters close to price, with a realistic 1-day hit rate, are the levels most likely to be tested.
- Check what is on the way. A level with a lot of size between here and there is easier to reach once price starts moving.
- Confirm with real liquidity. Compare with a liquidity heatmap: a cluster sitting behind thin order-book liquidity is easier to reach than one behind a thick wall of bids.
- Watch funding and open interest. Rising open interest with extreme funding means the clusters are growing.
You can filter by coin (40 supported), lookback from 24 hours to 1 year, exchange, leverage bucket and side (longs, shorts or both), and share the map as an image.
Try it free
The liquidation heatmap is open without an account as a preview (slightly delayed, lower resolution, top 10 coins). A free finqt account unlocks the full map with zones and insights.
Frequently asked questions
What is a liquidation heatmap?
A liquidation heatmap estimates the price levels where leveraged long and short positions would be force-closed. Bright areas mean a large estimated amount of liquidations at that price.
Are liquidation heatmaps accurate?
They are models. Exchanges do not publish every position's liquidation price, so leverage and entry prices are estimated from open interest and trading data. finqt also samples real on-chain positions from Hyperliquid to anchor the estimate.
Why does price move toward liquidation clusters?
When price reaches a cluster, positions are closed with market orders. Those forced orders push price further and can trigger the next cluster, which is why liquidation-driven moves are fast.
What is a liquidation cascade?
A cascade is a chain reaction where one wave of liquidations moves price into the next cluster, which liquidates more positions, and so on. High cascade risk means many clusters sit close together near the current price.
What is the difference between a liquidation heatmap and a liquidity heatmap?
A liquidation heatmap is a model of forced-close levels. A liquidity heatmap is recorded order-book data showing real resting limit orders. See liquidity heatmap vs liquidation heatmap. This is market education, not financial advice.