Short answer: a liquidity heatmap plots the order book over time. The vertical axis is price, the horizontal axis is time, and the colour of each cell shows how much size was resting at that price at that moment. Bright horizontal bands are large limit orders that stayed in the book; dark areas are thin liquidity. Price tends to slow down at bright bands and move fast through dark ones, which is why traders use heatmaps to find likely reaction zones, place stops outside obvious walls and spot liquidity that disappears right before price arrives.
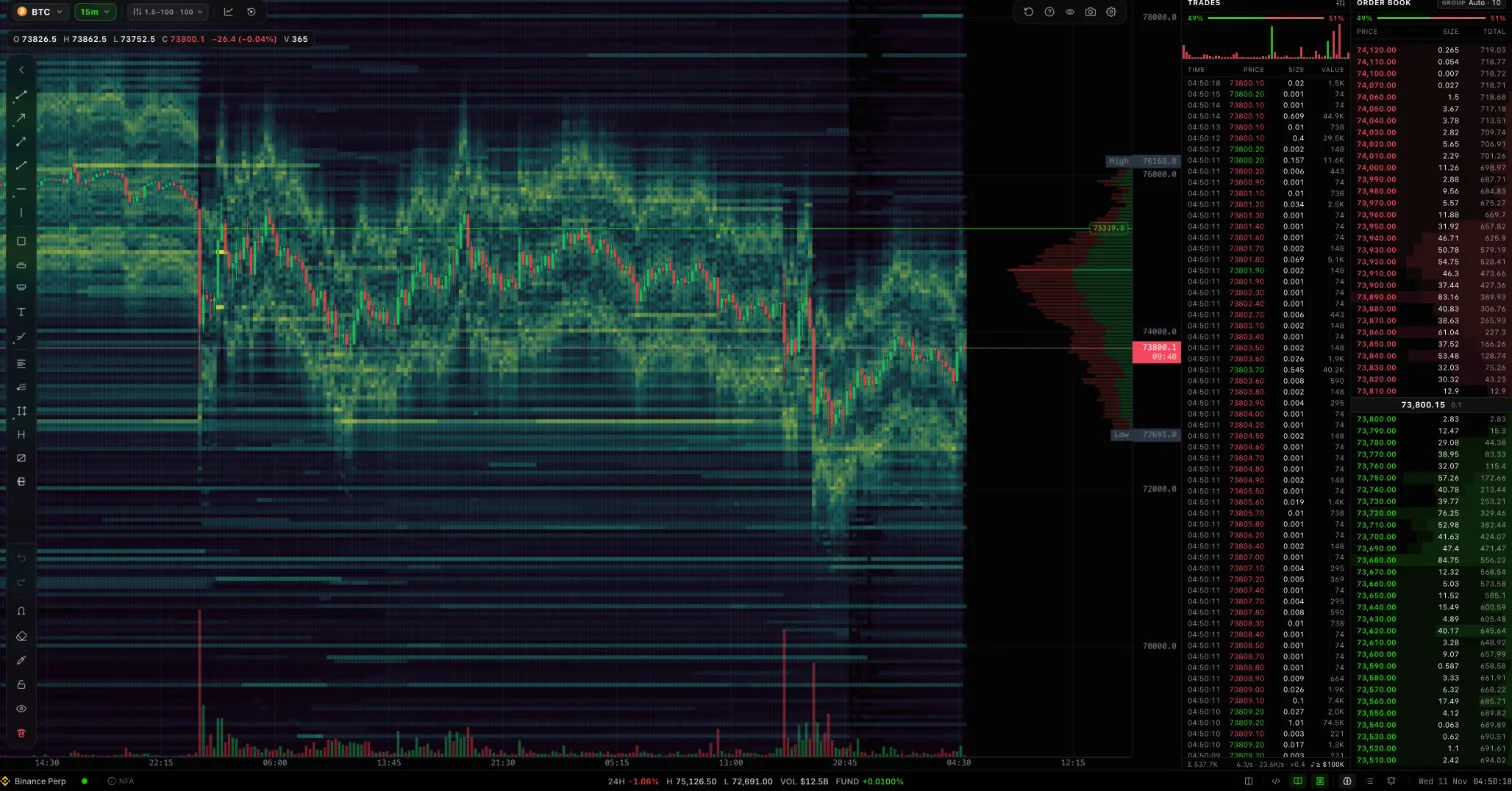 The finqt liquidity view on BTCUSDT perpetual (15m): heatmap, volume profile, trades and order book side by side
What a liquidity heatmap actually shows
A normal candlestick chart only shows trades that already happened. The order book shows the orders that could trade: every bid and ask resting at every price level. The problem is that the order book is a snapshot. It changes hundreds of times a second, and once a level is gone you cannot scroll back to see it.
A liquidity heatmap fixes that by recording the book continuously and drawing it as a picture:
- Each column is one moment (or one bar) in time.
- Each row is a price level.
- Each cell's colour is the resting size at that price and time. In finqt, dark blue-green is thin, yellow is heavy.
Put candles on top and you can see how price behaved around the liquidity that was actually there, not just where it traded.
How to read the colours
The most common mistake is reading the heatmap like a volume chart. Brightness is resting size, not traded volume. A level can glow for hours and never trade.
Read it in three layers:
- Persistent bands. A bright horizontal line that lasts many bars is a large order (or a cluster of orders) that someone left in the book. These are the levels market makers and larger traders are willing to defend, at least for now.
- Fading or pulled bands. A band that disappears before price reaches it was pulled. Pulled liquidity is information: whoever placed it no longer wants to be filled there.
- Dark gaps. Thin areas between bands are where price can travel quickly because nothing is resting there to absorb market orders.
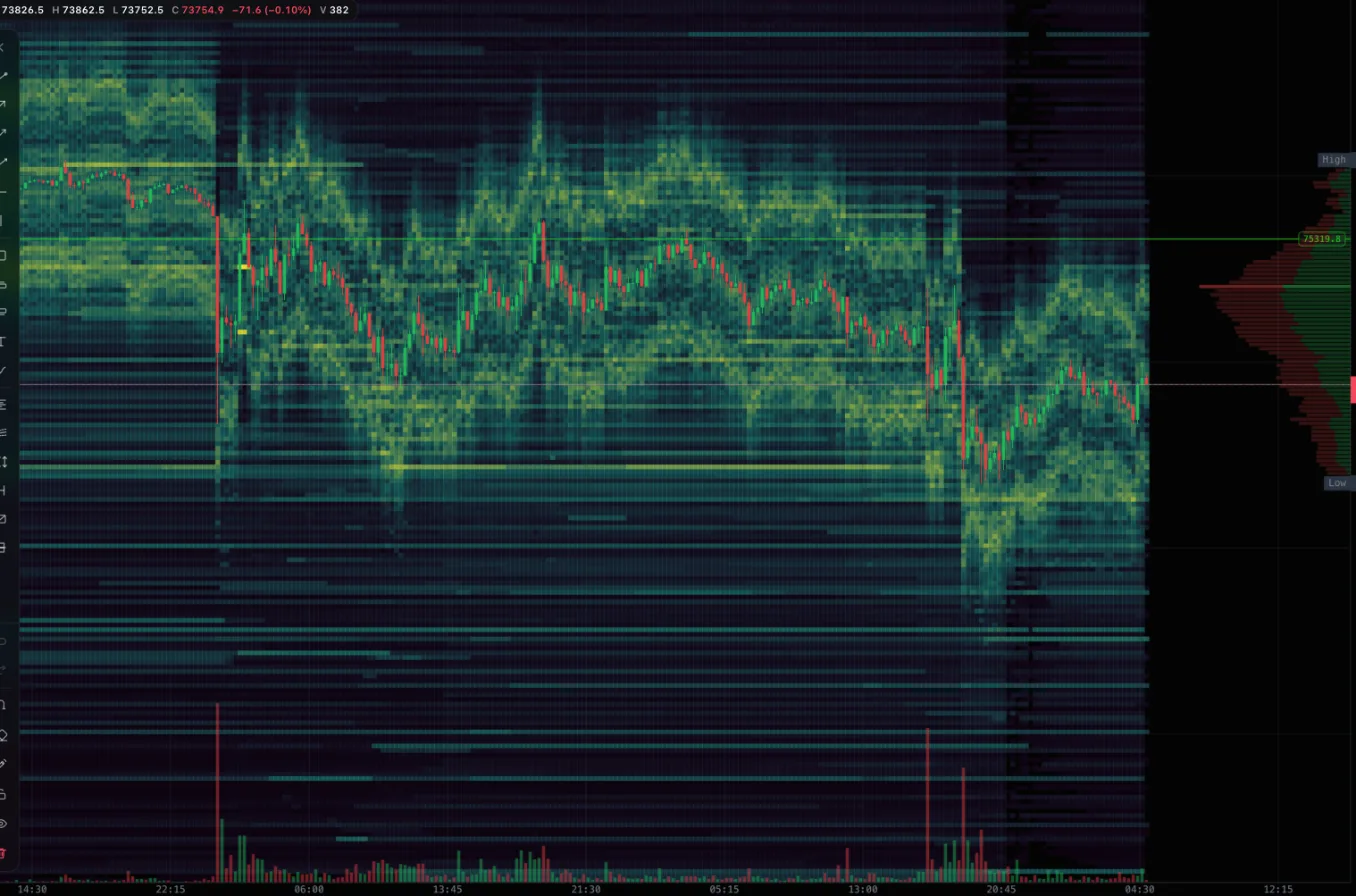 BTCUSDT liquidity heatmap on the 15-minute timeframe. Bright bands above and below price mark heavy resting orders
In the BTC example above, price spent most of the session inside a dense yellow zone, then dropped through a darker area and found support at the next bright band below. The move did not start at a random price. It started where liquidity thinned out.
Three patterns worth learning first
Absorption at a band
Price trades into a bright band, the band shrinks but does not disappear, and price stalls. Someone is absorbing the market orders. If the band holds while volume spikes, that level is doing real work. If it is eaten completely, the next move often accelerates into the gap behind it.
Liquidity pulled ahead of price
A wall sits above price for a long time, then vanishes a few bars before price gets there. This is common and it is the reason you should never treat a single bright line as guaranteed support or resistance. Watch whether the band is still there when price arrives, not whether it was there an hour ago.
Stacked bands and gaps
When several bands stack close together, price usually grinds. When there is a wide dark gap between two bands, price usually travels the gap quickly. On higher timeframes this is often visible at a glance.
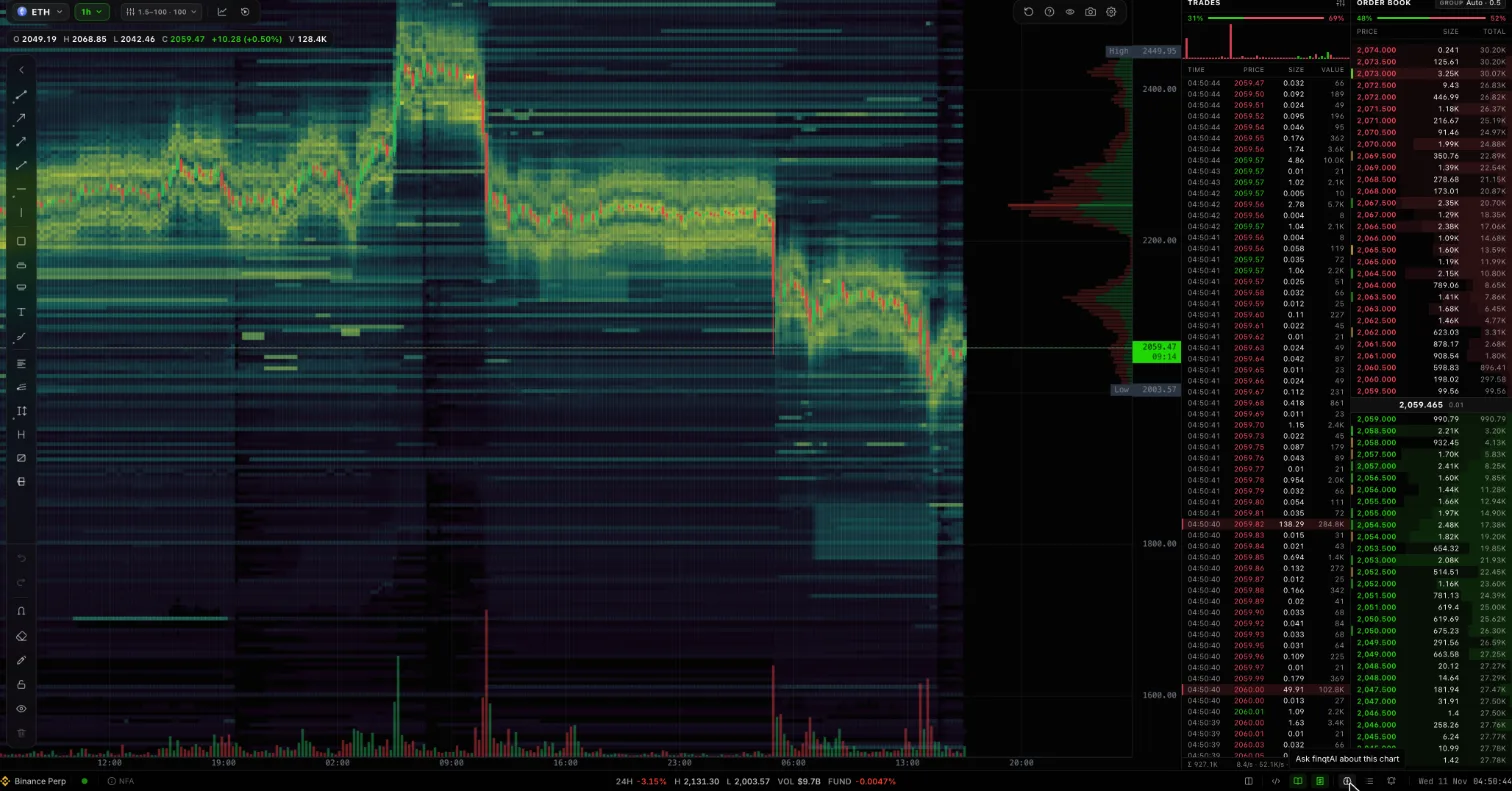 ETHUSDT liquidity heatmap on the 1-hour timeframe. Price drifted between two dense zones, then fell through thinner liquidity
The ETH 1-hour chart shows the same idea at a larger scale: a long consolidation inside a heavy zone, a sharp break, and a new range forming where liquidity re-appears lower down.
How to use it in a trading plan
A heatmap is context, not a signal. Practical ways to use it:
- Stops: place stops beyond a band, not right on it. Obvious walls attract price, and stops sitting exactly on them get swept.
- Entries: look for absorption at a band you already care about (a prior high, a range edge) instead of entering just because a band exists.
- Targets: the next bright band in the direction of your trade is a reasonable first target, because that is where opposing size is waiting.
- Timeframe: use 15m to 1h for structure, 1m to 5m for execution. Higher timeframes show which bands persisted; lower timeframes show what happens when price touches them.
Always pair the heatmap with the tape and the order book. The tape tells you whether market orders are actually hitting the level; the book tells you what is resting right now.
How finqt builds its heatmap
finqt records the full order book for the most liquid symbols on Binance futures, Binance spot and Bybit continuously, so the heatmap has real history instead of only what your browser saw since you opened the page. In the web app you can move between timeframes, tune the colour scale so small orders do not drown out the big ones, and read the heatmap next to a volume profile, the live trades tape and the order book.
The liquidity view lives next to the rest of finqt, so you can ask finqtAI about the chart you are looking at without leaving the screen.
Frequently asked questions
What is a liquidity heatmap?
A liquidity heatmap is a chart of the order book over time. Price is on the vertical axis, time on the horizontal axis, and colour shows how much size was resting at each price. Bright areas mean large limit orders; dark areas mean thin liquidity.
Is a liquidity heatmap the same as a liquidation heatmap?
No. A liquidity heatmap shows real resting limit orders in the order book. A liquidation heatmap estimates where leveraged positions would be force-closed, based on open interest and leverage assumptions. One is observed data, the other is a model.
Which timeframe is best for a liquidity heatmap?
Use 15 minutes to 1 hour to find the bands that matter and 1 to 5 minutes to watch how price reacts when it reaches them. Very low timeframes are noisy; very high ones hide pulled orders.
Can large orders on a heatmap be fake?
Yes. Orders can be placed and pulled without ever trading, which is why a band only matters if it is still there when price arrives. Watch for absorption on the tape rather than trusting a wall on its own.
Does a liquidity heatmap predict price?
No tool predicts price. A heatmap shows where liquidity is and how it changes, which helps you choose better entries, stops and targets. It is market research, not financial advice.